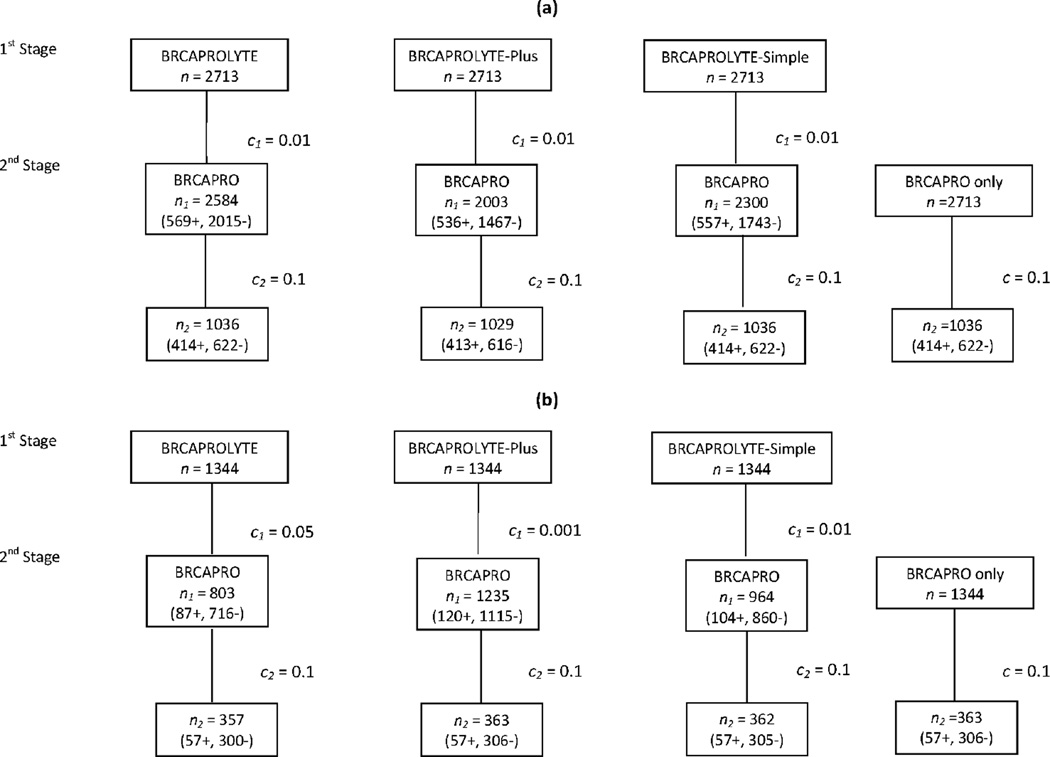
Figure 1.
Numbers of referrals made at each stage using a two-stage approach, as compared to using BRCAPRO only on all probands for (a) CGN+MDA and (b) NWH data. We denote by c1 and c2 the cutoffs used at the first and second stages, respectively. The number of probands whose carrier probability at the first stage exceed c1 is denoted by n1, and out of n1, the number of probands with second stage carrier probability exceeding c2 is denoted by n2. When we evaluate BRCAPRO alone, the cutoff is labeled as c and the number of probands with carrier probability exceeding c is n2. These numbers are further stratified by the carrier status in parentheses.

