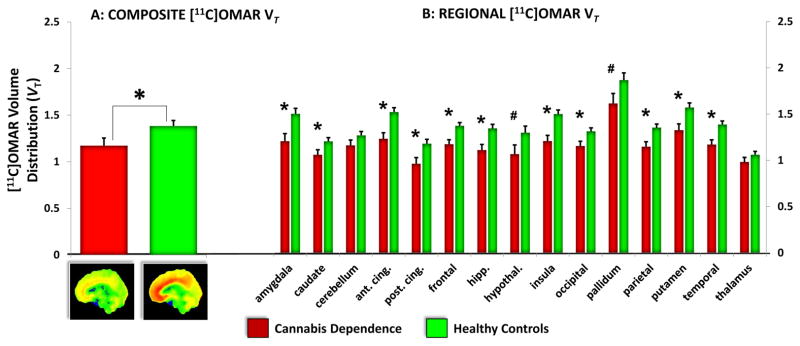
Figure 1. Composite & Regional CB1R Availability in cannabis Dependent subjects compared to Healthy Controls at Baseline.
A: Composite [11C]OMAR VT
The figure on the left shows the mean and standard error bars of composite [11C]OMAR VT in Cannabis Dependent subjects (n=11) (red) compared to Healthy Controls (n=21) (green). Statistically significant group differences are indicated with *. Below the figure on the left are grand averaged Grand Averaged [11C]OMAR VT in CDs (left) vs. HCs (right) at Baseline.
B: Regional [11C]OMAR VT
The figure on the right shows the mean and standard error bars of regional [11C]OMAR VT in Cannabis Dependent subjects (red) compared to Healthy Controls (green) across different brain regions. Statistically significant group differences are indicated with *. Trend level group differences are indicated with #.

