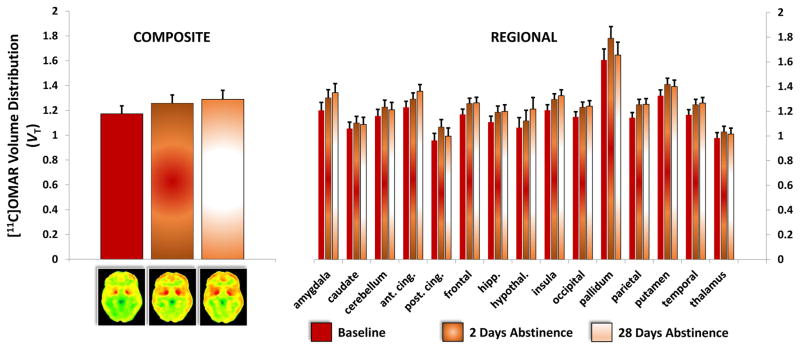
Figure 3. Composite and Regional CB1R Availability in CDs Over Time.
The figure on the left shows the mean and standard error bars of composite [11C]OMAR VT in Cannabis Dependent subjects at baseline (n=11), after 2 days of abstinence (n=10) and after 28 days of abstinence (n=8). Below the figure on the left are the corresponding grand averaged Grand Averaged [11C]OMAR VT in CDs at baseline (n=11), after 2 days of abstinence (n=10) and after 28 days of abstinence (n=8).
The figure on the left shows the mean and standard error bars of regional [11C]OMAR VT in Cannabis Dependent subjects at baseline (n=11), after 2 days of abstinence (n=10) and after 28 days of abstinence (n=8). See text for statistics.

