
Fig. 1.
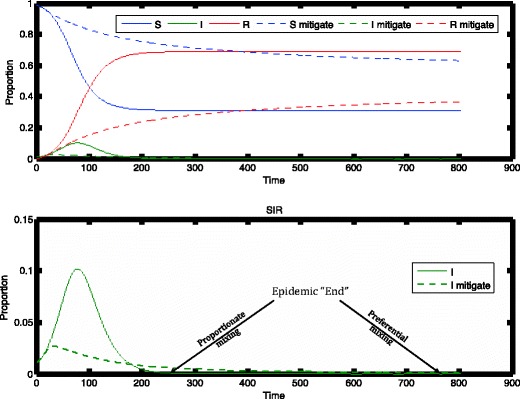
The upper panel shows trajectories for the baseline set of epidemiological parameters for an SIR model with and without mitigation (dashed and solid lines, respectively). The susceptible and recovered trajectories are removed to show the trajectory of infectious individuals in the lower panel. The final epidemic size for this example is 33 % less with mitigation than with proportionate mixing, and the peak level of infection is 70 % less. Epidemic end of I(t) = 0.0005 is marked for the two models