
Fig. 2.
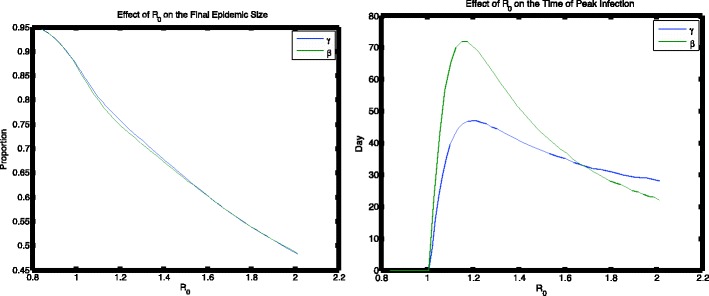
In this figure, we show the effect that varying R0 has on the final epidemic size and time to peak infection levels. Notice that while β and γ each have the same qualitative effect, they have different effects quantitatively. For R0 ≈ 1.65, we observe a switch in which parameter produces the larger magnitude metric