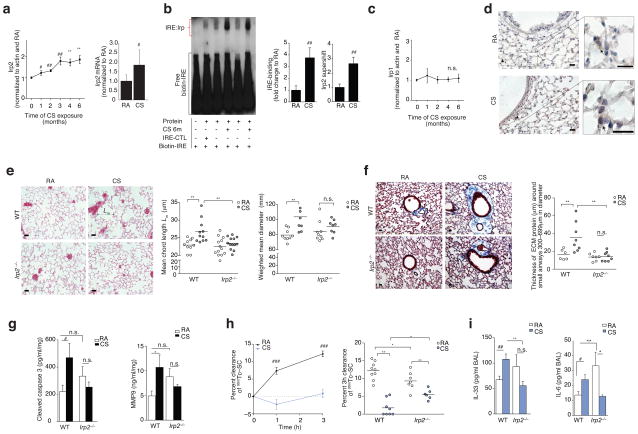
Figure 1.
Irp2 is pathogenic in experimental COPD. (a) Irp2 protein (left), mRNA (right) (n = 8 per group), (b) representative (n = 4) EMSA (left) with quantification of total-Irp (n = 5 per group) and specific-Irp2 activity (n = 3 per group), (c) Irp1 protein expression (n = 3 per group) and (d) representative Irp2 immunostaining (arrows indicate Irp2) in WT mouse lungs exposed to room air (RA) or CS (1–6 months). (e) Representative Hematoxylin-Eosin stained lung-sections (left), (n= 3 mice per group) mean chord length (middle), weighted mean diameters (right) and (f) representative trichrome stained lung-sections (left) and ECM protein thickness around small airways (right) in WT and Irp2−/− mice exposed to RA or CS (6 months), staining; n = 2 technical replicates. (g) Cleaved caspase 3 (left) (ELISA, n = 7 per group) and MMP-9 (right) (ELISA, WTRA n = 5; WTCS n = 3; Irp2−/− RA, CS n = 6) levels in whole lung of WT and Irp2−/− mice exposed to RA or CS (6 months), n = 2 technical replicates. (h) 99mTc-SC clearance over 1–3 hours (left) in WT mouse lungs exposed to RA (n = 9) or CS (n = 10) (1 month). 3 hour 99mTc-SC clearance (right), (i) BALF IL-33 (left, ELISA; WTRA n = 3; WTCS n = 5; Irp2−/− RA n = 5; Irp2−/−C n = 6) and BALF IL-6 protein concentrations (right, ELISA, n = 3 per group) in WT and Irp2−/− mice exposed to RA or CS (1 month). (d–f) Scale bars, 50 μm. All data are mean ± s.e.m. *P < 0.05, **P < 0.01, ***P < 0.005 by one-way ANOVA with Bonferroni correction. #P < 0.05, ##P < 0.01, ###P < 0.005 by student’s unpaired t-test. n.s., not significant.

