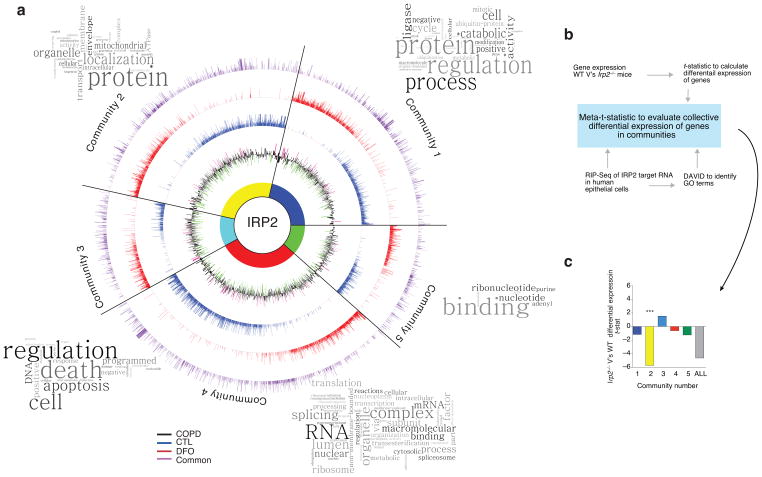
Figure 2.
Novel targets of IRP2 in the lung. (a) Circos plot of communities of genes and GO terms to demonstrate gene transcripts and pathways enriched and/or altered in the RIP-Seq data set. CTL-specific (blue), DFO-specific (red) and common (purple) peak data sets are represented by individual rings, with the height of bars corresponding to the peak score (n = 2 biological replicates). Gene expression data (mRNA) from the LGRC (n = 121 COPD subjects, n = 20 non-smokers and n = 18 smokers) represented on inner black ring. The height of these bars corresponds to the log2 fold-change (FC) in gene expression levels between subjects with COPD and controls. Green denotes lower expression in COPD and magenta denotes higher expression in COPD. Word Clouds representing GO terms in each community with the size of each word reflecting its frequency among the names of the pathways in the community. Community 1 shows enrichment for the cell cycle, metabolism of RNA, the proteasome and immune system; community 2 for metabolism, mitochondria and membrane trafficking; community 3 for DNA repair, apoptosis, the cell cycle and signal transduction; community 4 for metabolism of proteins, transcription and translation; community 5 for nucleotide/purine metabolism pathways. (b) Functional enrichment clustering analysis workflow to evaluate collective differential expression of genes in “communities” of RIP-Seq and in Irp2−/− versus WT gene expression data. (c) Results of functional enrichment clustering analysis. ***P = 1.08 x10⁻⁸ by a two-tailed unpaired t-test.

