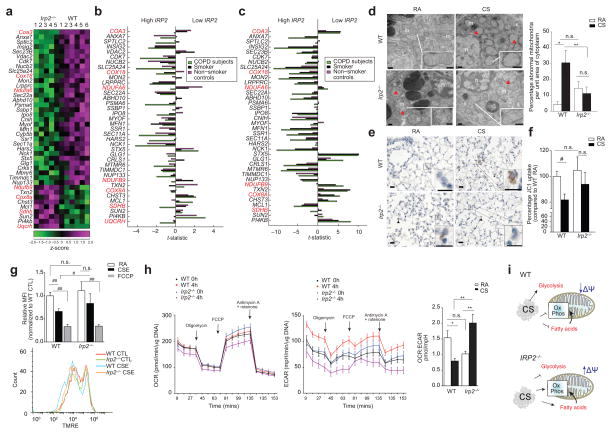
Figure 3.
Irp2−/− mice resist CS-induced mitochondrial dysfunction. (a) Community 2 genes that annotated to ‘mitochondria’ GO categories. Red text indicates mitochondrial OXPHOS genes. (b–c) Differential-expression of genes from (a) in the human COPD cohorts (b) LGRC (n = 121 COPD, n = 18 smokers and n = 20 non-smokers) and (c) ECLIPSE (n = 136 COPD, n = 84 smokers, n = 6 non-smokers) related to low or high IRP2 expression. (d) Representative TEM images (n=20 images per mouse) (left) and quantification (right) of WT or Irp2−/− mouse airways exposed to RA or CS (4 months)(15 EM fields, n = 1 per group). Scale bar: 500 nm. Arrows indicate ‘abnormal’ mitochondria. n; nuclei; m; mitochondria. (e) Representative cytochrome c immunostaining (n=3 mice per group) (arrows indicate staining, scale bar, 50 μm) and (f) percentage JC1 uptake (mitochondrial-enriched fractions, n = 3 technical replicates) of WT or Irp2−/− mouse lungs exposed to RA or CS (4 (e) or 6 months (f)). (g) Representative TMRE staining (n=3 experiments) (bottom) (n = 2 technical replicates) with fold change mean fluorescent intensity (top) of TMRE, (h) OCR (left) and ECAR (right) normalized to Hoechst (n = 12 technical replicates) of WT and Irp2−/− primary lung epithelial cells treated with 20% CSE (4 hours) or FCCP (30 mins). (i) Schematic of the role of IRP2 in mitochondrial responses to CS. All data are mean ± s.e.m.: #P < 0.05. ##P < 0.01 by student’s unpaired t-test. *P < 0.05, **P < 0.01 by one-way ANOVA with Bonferroni correction.

