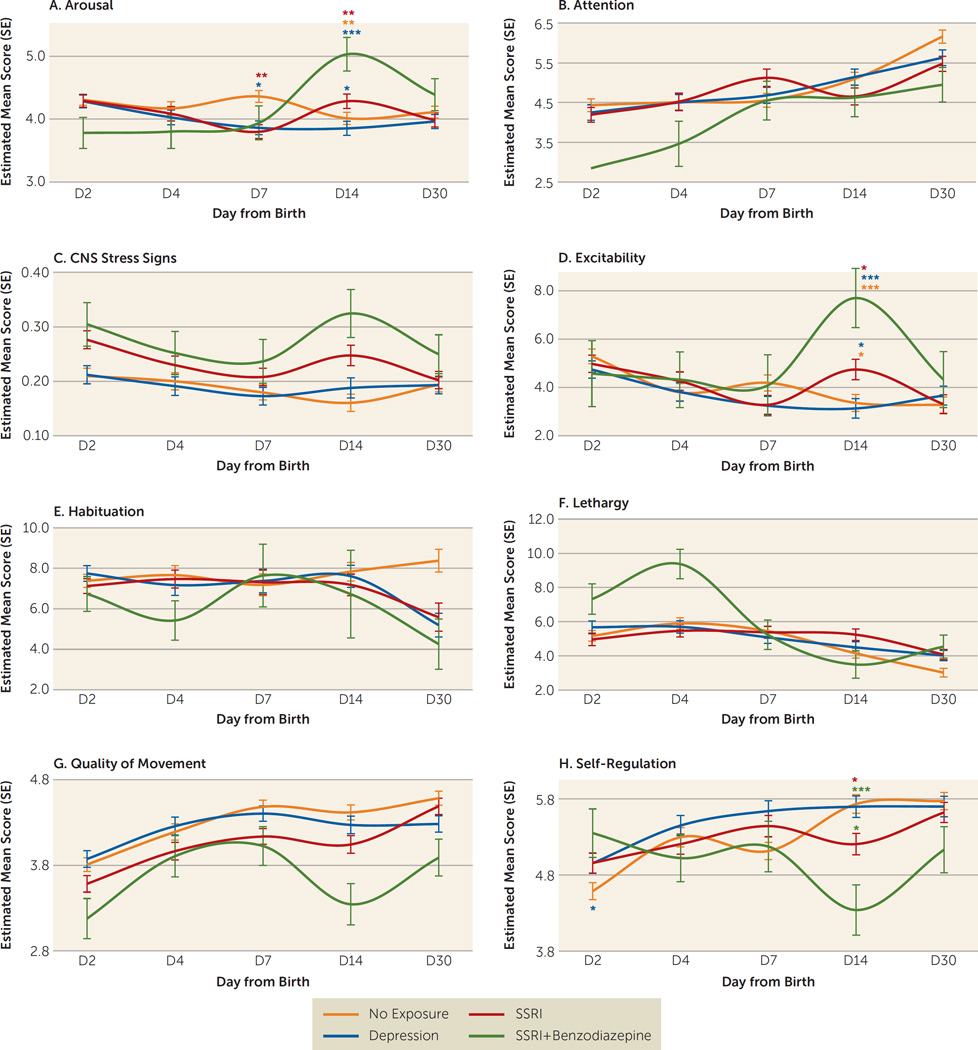
FIGURE 1.
Model 3 Model-Estimated Means of the Significant Neonatal Intensive Care Unit Network Neurobehavioral Scale Summary Scores Over Days From Birth for Each of the Four Groupsa
a The graphs represent the model adjusted for covariates of gestational age at birth, infant sex, socioeconomic status, and depression severity. For A) arousal, the results are: day 7, no exposure. depression; day 14, selective serotonin reuptake inhibitor (SSRI).depression, SSRI plus benzodiazepine. depression, SSRI, and no exposure; the trajectory is a significant cubic trend for all groups (χ2=9.59, p<0.002); a quadratic trend is within the no-exposure group (estimate=0.30, SE=0.12, t=2.6, p<0.011) and SSRI plus benzodiazepine group (estimate=−0.75, SE=0.32, t=−2.32, p<0.021); simple slope of the Inventory of Depressive Symptomatology score within group is significant for the depression group (estimate=0.02, SE=0.01, t=2.5, p<0.013) and SSRI group (estimate=−0.02, SE=0.01, t=−2.4, p<0.027). For B) attention, the results are: the trajectory has a significant linear (χ2=5.6, p<0.02) and quadratic (χ2=4.5, p<0.04) trend. For C) CNS stress signs, the results are: the trajectory has a significant cubic trend (χ2=3.8, p<0.05). For D) excitability, the results are: the trajectory has a significant cubic trend for all groups (χ2=7.9, p<0.005); within the no-exposure group, the trajectory has a significant linear (estimate=−0.19, SE=0.41, t=−2.9, p<0.005) and quadratic (estimate=1.6, SE=0.42, t=2.8, p<0.006) trend. For E) habituation, the results are: the trajectory over time is not statistically significant; however, mean scores at day 30 for the depression, SSRI, and SSRI plus benzodiazepine groups are all lower than the 5th percentile for normative scores at this age, while the no-exposure group is greater than the 50th percentile. For F) lethargy, the results are: the trajectory has a significant linear (χ2=5.2, p<0.02), cubic (χ2=5.4, p<0.021), and quartic (χ2=5.15, p<0.023) trend. For G) quality of movement, the results are: the trajectory has a significant linear (χ2=8.3, p<0.004) and cubic (χ2=10.2, p<0.002) trend. For H) self-regulation, the results are: day 2, no exposure, depression; day 14, SSRI, no exposure and depression, SSRI plus benzodiazepine, depression and SSRI; the trajectory has a significant cubic trend for all groups (χ2=9.0, p<0.003) and within the no-exposure group, a linear (estimate=6.9, SE=0.14, t=4.9, p<0.0001) and quadratic (estimate=−0.6, SE=0.14, t=−4.2, p<0.0001) trend.
*p<0.05; **p<0.01, ***p<0.001.

