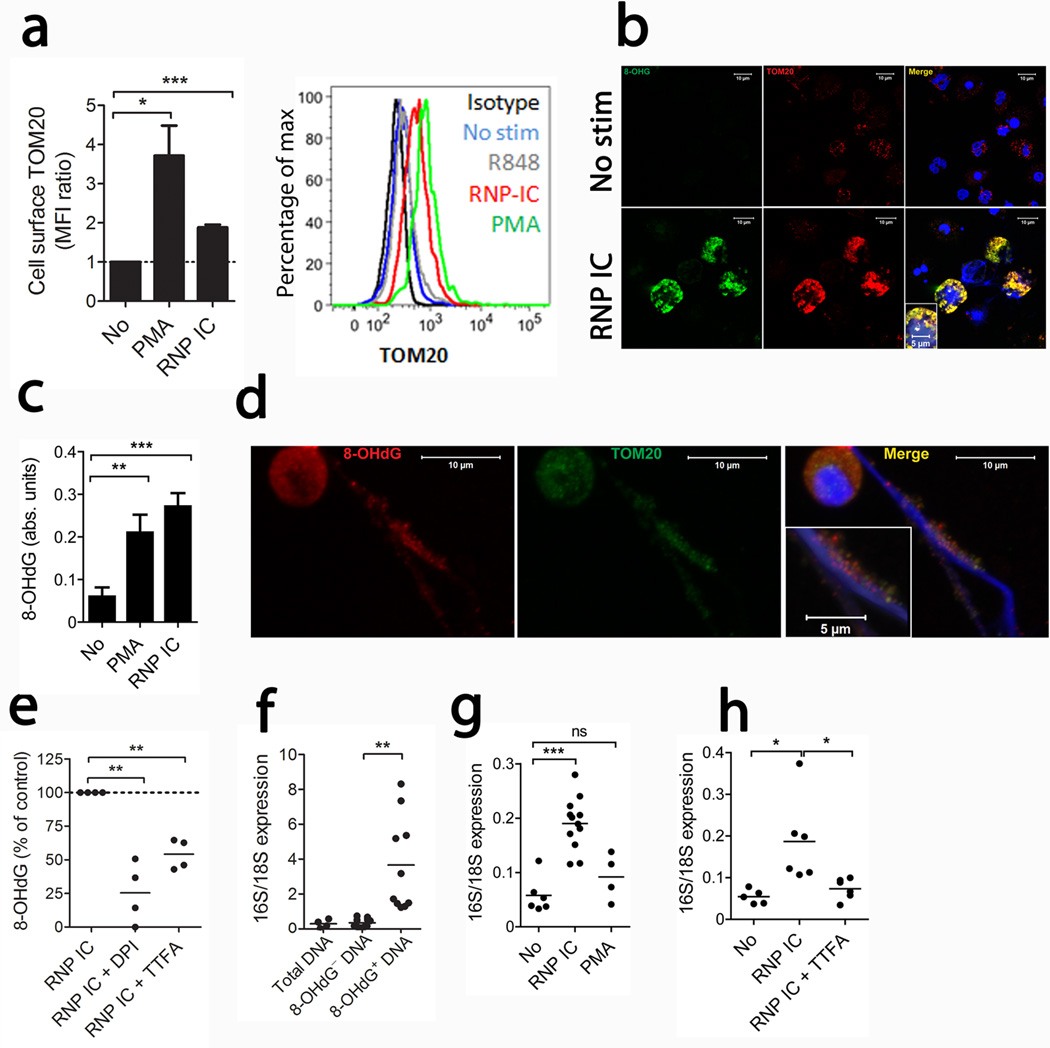
Figure 2. RNP ICs induce mitochondria mobilization and release of oxidized DNA.
(a) Cell surface staining of TOM20 in non-fixed cells is shown expressed as TOM20 mean fluorescence intensity (MFI) ratio as compared to non-stimulated neutrophils (n = 7 in each group, statistics by paired t-test). (b) Representative immunofluorescence images of non-permeabilized neutrophils stimulated with or without RNP ICs stained for cell surface expression of TOM20 (red), 8-OHdG (green) and Hoechst (blue) to detect DNA. The images are representative of 3 independent experiments. (c) Quantification of 8-OHdG content in NETs by ELISA with results expressed as absorbance units (n= 8, 5 and 6 for no, PMA and RNP ICs, respectively, statistics by t-test). (d) Confocal microscopy of RNP IC-induced NETs stained with TOM20 (green), 8-OHdG (red) and Hoechst (blue). The images are representative of 3 independent experiments. (e) Quantification of 8-OHdG content in neutrophils in presence of ROS inhibitors. Results are presented as % of control from 4 independent experiments and analyzed by paired t-test. (f) Quantification of 16S and 18S mRNA from immunoprecipitated DNA. The results are reported as the mean of the 16S/18S expression from 4 (total DNA) and 10 independent experiments and analyzed by paired t-test. (g) Quantification of NET-derived 16S and 18S DNA from 6 (No), 12 (RNP IC) and 4 (PMA) and (h) 5 (No), 6 (RNP IC) and 7 (RNP IC+TTFA) independent experiments analyzed by t-test with *P < 0.05, **P < 0.01 and *** P < 0.001.

