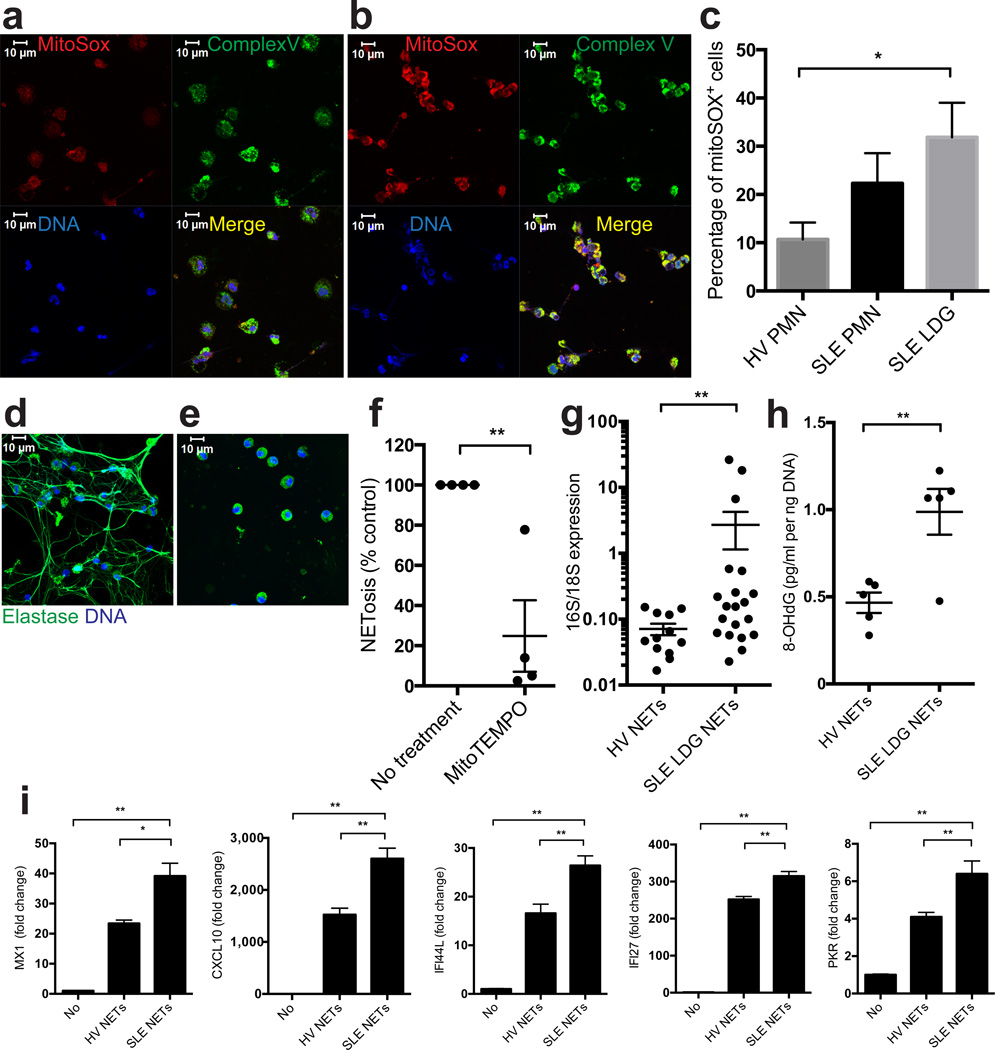
Figure 4. SLE LDGs release oxidized mitDNA in a mitochondrial superoxide-dependent manner.
(a–c) Mitochondrial ROS synthesis is enhanced in SLE LDGs. Non-stimulated NDGs from (a) healthy control or (b) SLE LDGs stained with MitoSOX (red), mitochondrial complex-V subunit D (green) and DNA (Hoechst 33342). Results are representative of 3 independent experiments. (c) Mitochondrial ROS quantification (MitoSOX) by flow cytometry in non-stimulated healthy control NDGs (n = 6) and SLE NDGs and LDGs (n= 7/group). (d–f) LDG NETosis is inhibited by mitochondrial ROS scavengers. Representative images of 5 independent experiments depict maximum intensity projections of a z scan of lupus LDGs incubated for 90 min in the absence (d) or presence (e) of MitoTEMPO. Green represents HNE and blue represents DNA (Hoechst). (f) Spontaneous NET formation in lupus LDGs (n=4) in the presence or absence of MitoTEMPO and TTFA. (g) Relative mitochondrial (16S)/chromosomal (18S) ratio in NET DNA (n = 12 for control NDGs, n = 20 for lupus LDGs). (h) 8-OHdG content in NET DNA (n = 5 in each group). (i) ISG mRNA levels at 20 hours in THP-1 cells transfected with DNA purified from SLE LDGs NETs (SLE NETs, n = 3) or from healthy control NDGs NETs induced by A23187 (HV NETs, n = 2). Results are the mean ± SEM of at least 3 independent experiments. For the statistical analyses, 2-sided unpaired t-test (c,h) and Mann Whitney U test (f–i), were used; * P< 0.05; ** P < 0.01.

