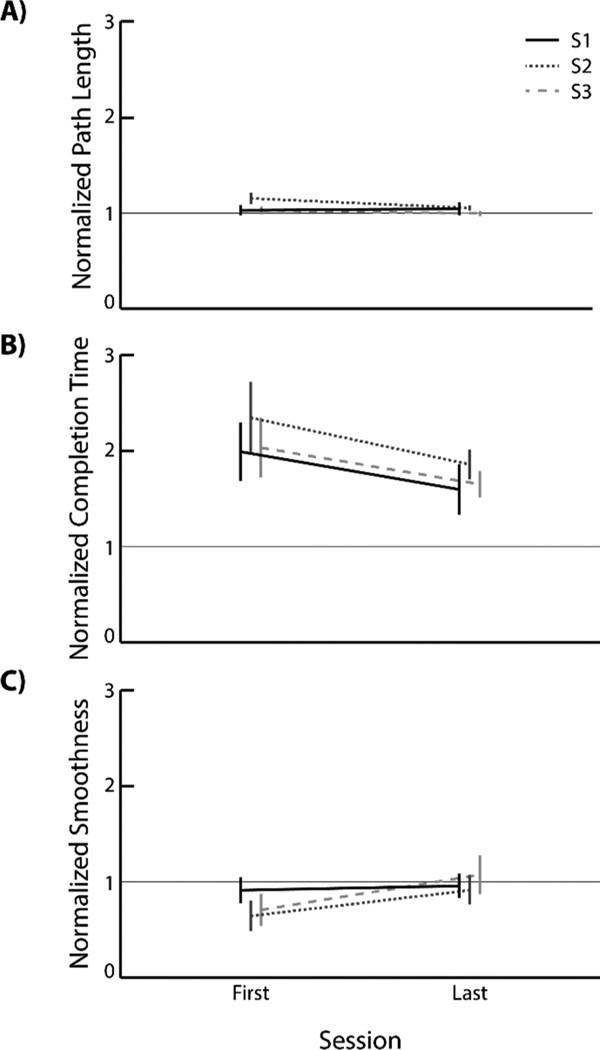
Figure 3.
Driving performance across of sessions. The three plots show each of the three performance metrics, path length (A), completion time (B), and smoothness (C). All measures were normalized by joystick performance. Different colored lines represent different subjects. Error bars represent 95% confidence intervals.

