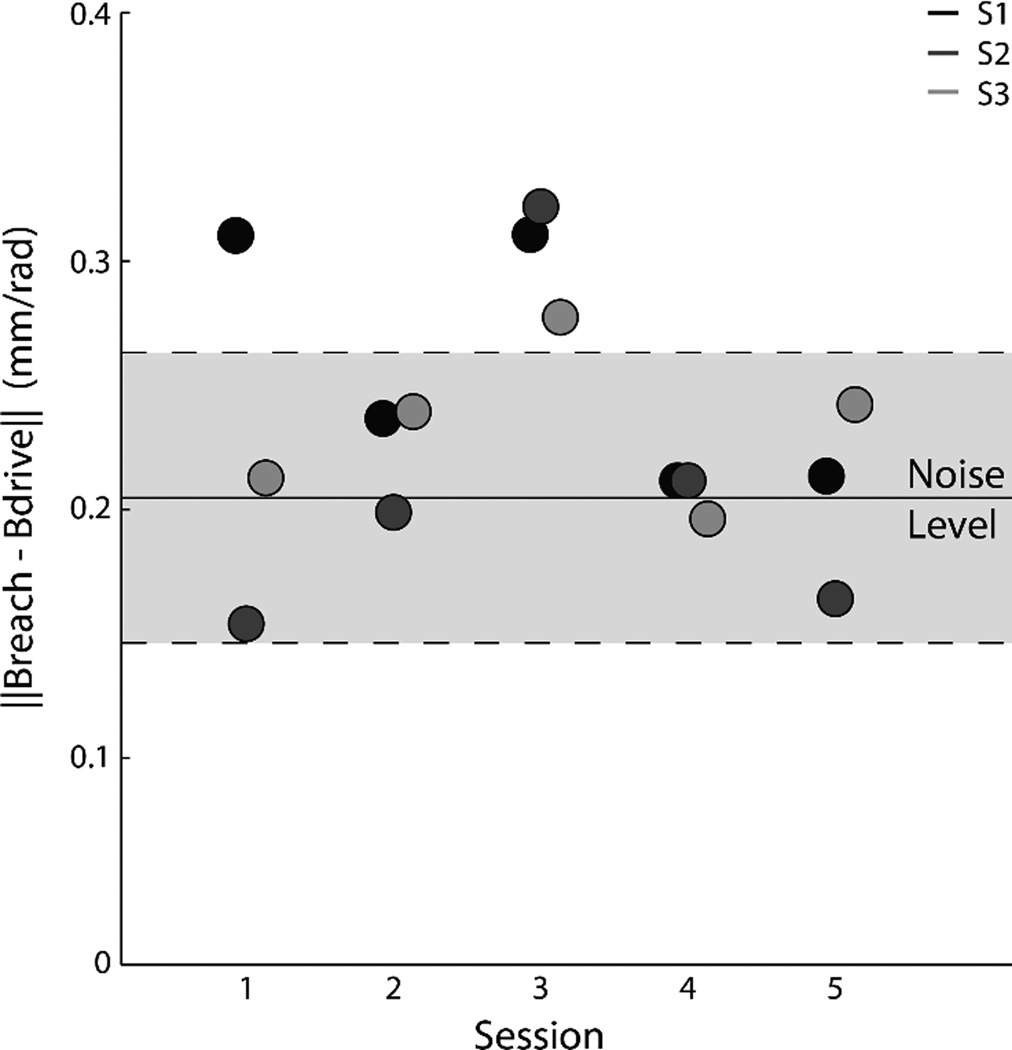
Figure 8.
The difference in inverse map used for reaching and driving across all sessions. Each circle indicates the norm of the difference between the estimated inverse map used for reaching (B̂reach) and driving (B̂drive). Different colors represent different subjects. The grey area represents the noise, and is the mean difference between the estimated inverse for subsequent driving sessions averaged across all subjects ± 1 standard deviation.

