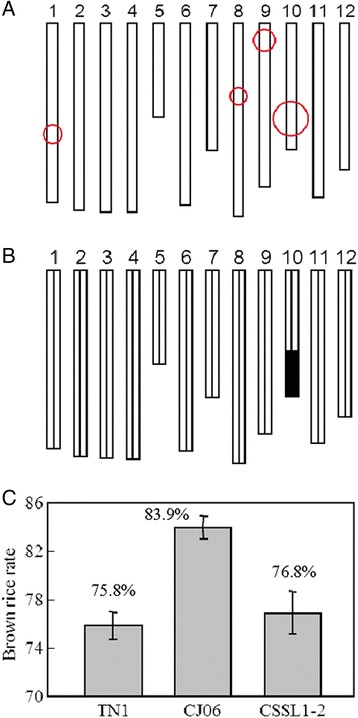
Fig. 4.

The development of CSSL. a QTL analysis for brown rice rate in DH population. Circle centers indicate positions of QTLs on the rice chromosomes. Circle sizes indicate contributions to explained variation for brown rice rate. b Graphical genotype of CSSL1-2 (a substitution line of chromosome 10. Black bar indicates the genome fragment from TN1; the other parts were from CJ06. c The brown rice rate for CJ06, TN1 and CSSL1-2
