
Fig. 2.
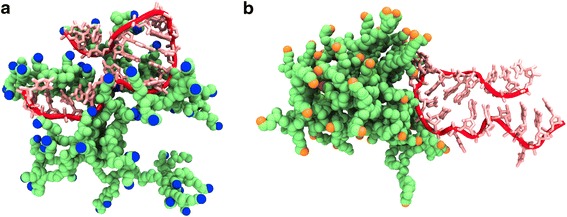
Last snapshot of molecular dynamics simulations of a PAMAM-NH2 and b PAMAM-OH dendrimers in complex with asODN (taken at 100 ns). The dendrimers are represented in green, the primary amine groups are colored in blue in PAMAM-NH2, and hydroxyl groups are colored in orange in PAMAM-OH. Hydrogen, water, and counterions were omitted for visualization. asODN is represented in red