
Fig. 5.
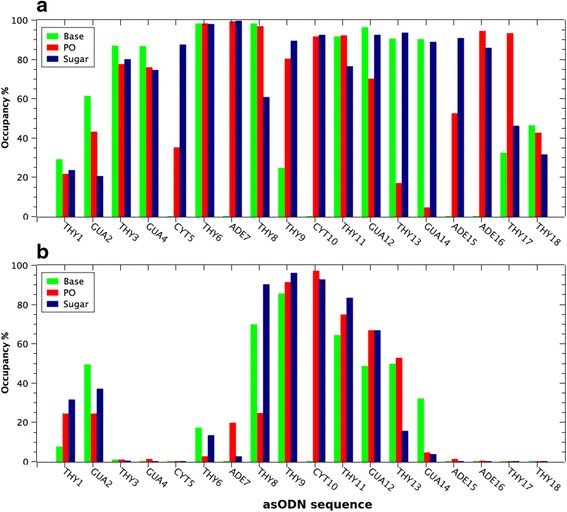
Percentage of time occupancy (y axis) of contacts at 3.5 Å between each asODN nucleotide (x axis) considering phosphate (PO), sugar, and base groups and a PAMAM-NH2 and b PAMAM-OH terminal groups (–NH2 and –OH, respectively). One hundred percent represents the total number of frames of the last 10 ns of MD trajectory