
Fig. 6.
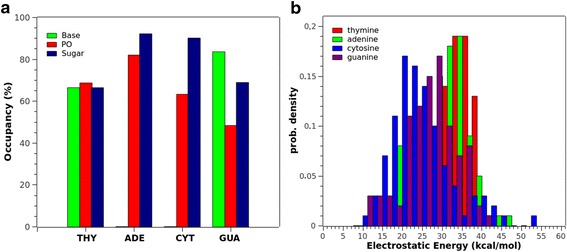
a Summary of the percentage of time occupancy (y axis) of contacts at 3.5 Å between each type of nucleotide base (x axis) considering phosphate (PO), sugar, and base groups and PAMAM-NH2. b Histogram of the electrostatic interaction energy of a single nucleotide base (A, T, C, G) and amine-terminal groups of PAMAM-NH2, obtained from the last 10 ns of MD trajectory