
Fig. 7.
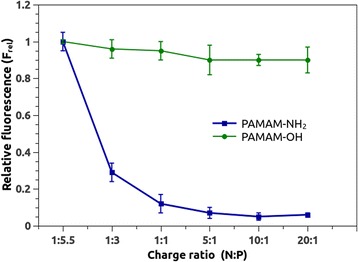
Effect of the terminal groups of dendrimer on asODN complexation by OliGreen fluorescence exclusion assay (n = 3). The figure shows mean and standard error bars for the relative fluorescence (y axis) and the respective charge ratio (x axis)
Official websites use .gov
A
.gov website belongs to an official
government organization in the United States.
Secure .gov websites use HTTPS
A lock (
) or https:// means you've safely
connected to the .gov website. Share sensitive
information only on official, secure websites.
Effect of the terminal groups of dendrimer on asODN complexation by OliGreen fluorescence exclusion assay (n = 3). The figure shows mean and standard error bars for the relative fluorescence (y axis) and the respective charge ratio (x axis)