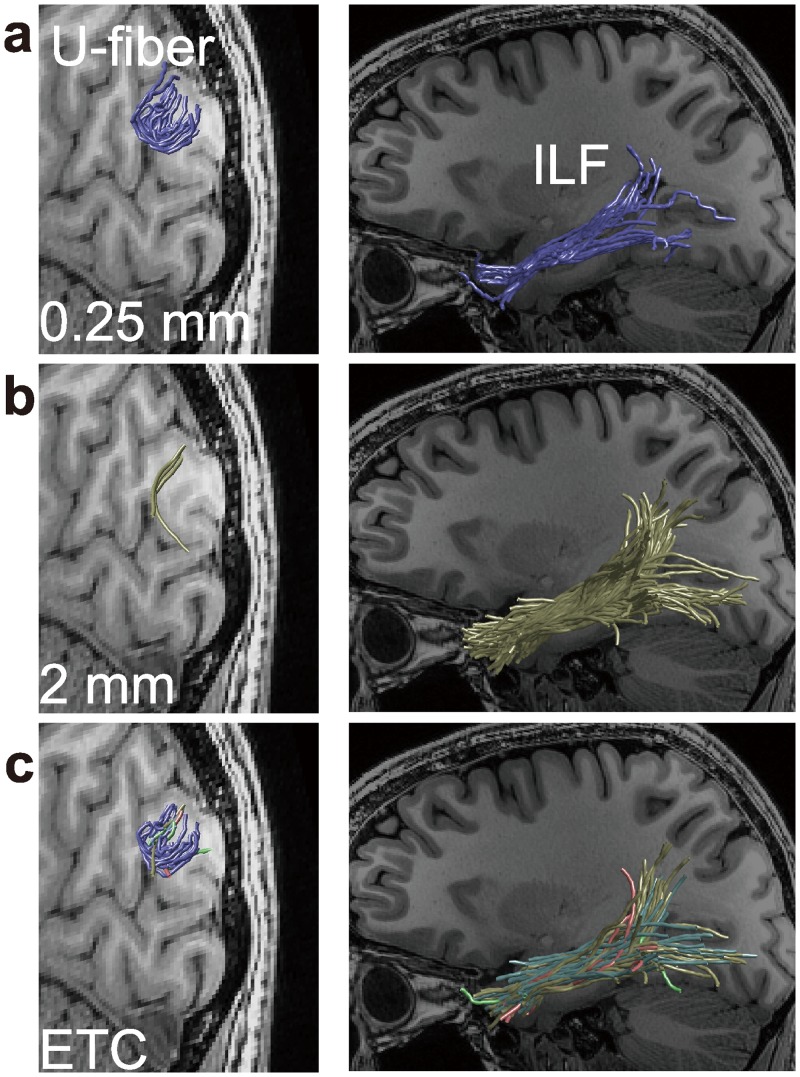
Fig 1. Short- and long-range fascicles supported by different parameter selections.
The two columns compare short-range fascicles (left, U-fiber) connecting V3A/B and V3d and long-range fascicles (right, the inferior longitudinal fasciculus; ILF) segmented from different connectome models. The images show extremely different estimates using a low minimum radius of curvature threshold (a, 0.25 mm) and high threshold (b, 2 mm). a. The 0.25 mm results show a dense set of short-range fascicles, but a thin set of long-range fascicles. b. Conversely the 2 mm results show sparse short-range fascicles and dense long-range fascicles. c. Ensemble Tractography generates connectomes including both short- and long-range fascicles. Streamline colors in c indicate different parameter settings used to generate the streamlines (blue, 0.25 mm; green, 0.5 mm; red, 1 mm; yellow, 2 mm; light blue, 4 mm). Results are shown from one left hemisphere (subject 1, STN96 data set; see Material and Methods).

