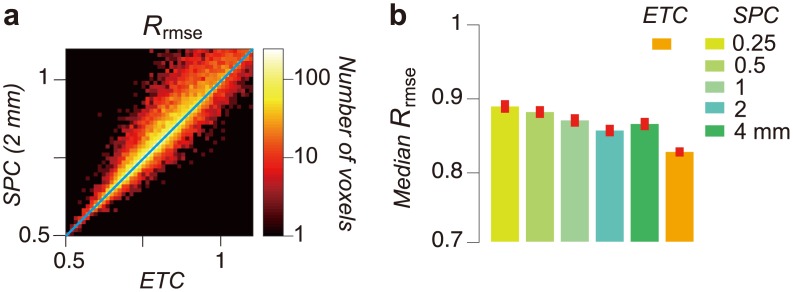
Fig 5. Comparison of SPC and ETC connectome relative error.
a. Comparison of Rrmse across two representative connectome models (horizontal axis: ETC, vertical axis: SPC 2 mm) in subject 1, left occipital cortex in STN96 dataset. Color chart depicts the number of voxels. In many voxels, ETC error is lower than the error of the 2 mm SPC model. b. Comparison of Rrmse across all models in occipital cortex of 10 hemispheres in STN96 dataset. Vertical axis indicates a median of Rrmse across occipital cortex voxels. Error bar depicts ±1 s.e.m. across hemispheres.

