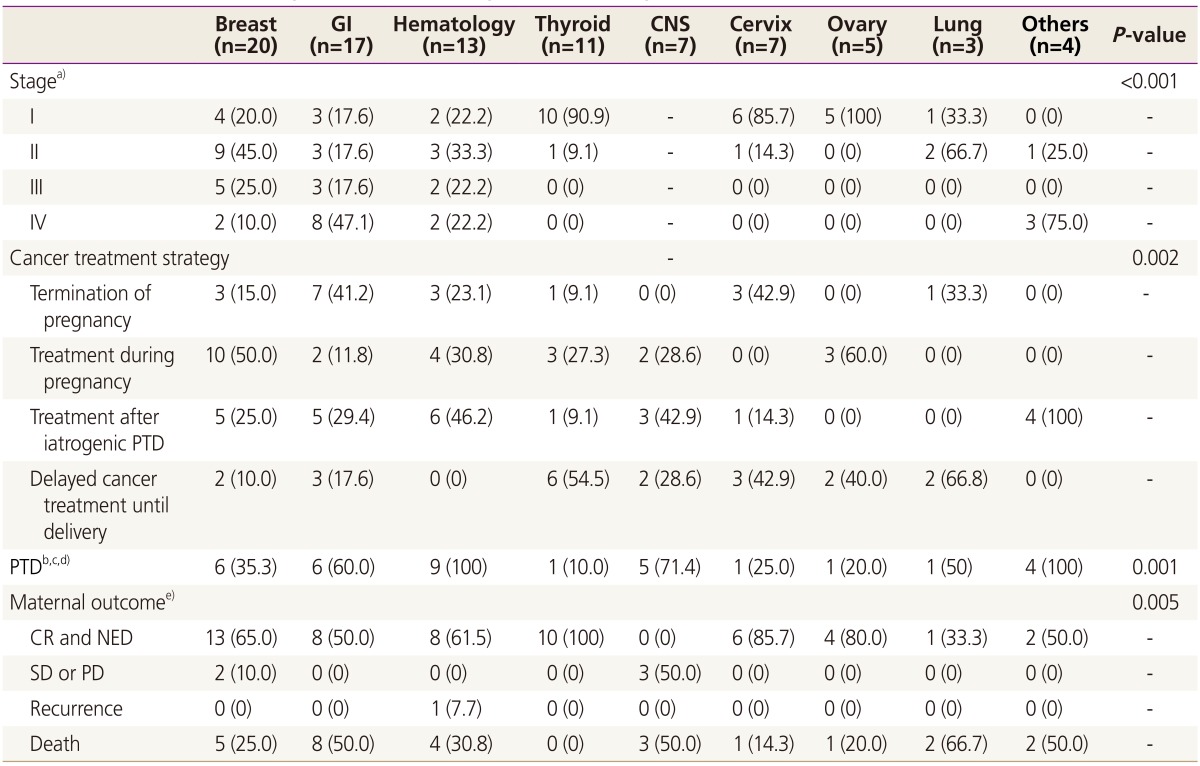
Table 4. Comparisons of the stage and outcome among different cancer groups.
Data are expressed in number (%).
GI, gastrointestinal; CNS, central nervous system; PTD, preterm delivery; CR, complete response; NED, no evidence of disease; SD, stable disease; PD, progressive disease.
a)Stage was unavailable for 11 cases (7 brain tumor cases and 4 leukemia cases); b)Only the patients who maintained the pregnancy were included in the analysis; c)Both iatrogenic and spontaneous preterm delivery; d)One case of abortion was excluded from the analysis; e)Three cases who were lost to follow up was excluded from the analysis.

