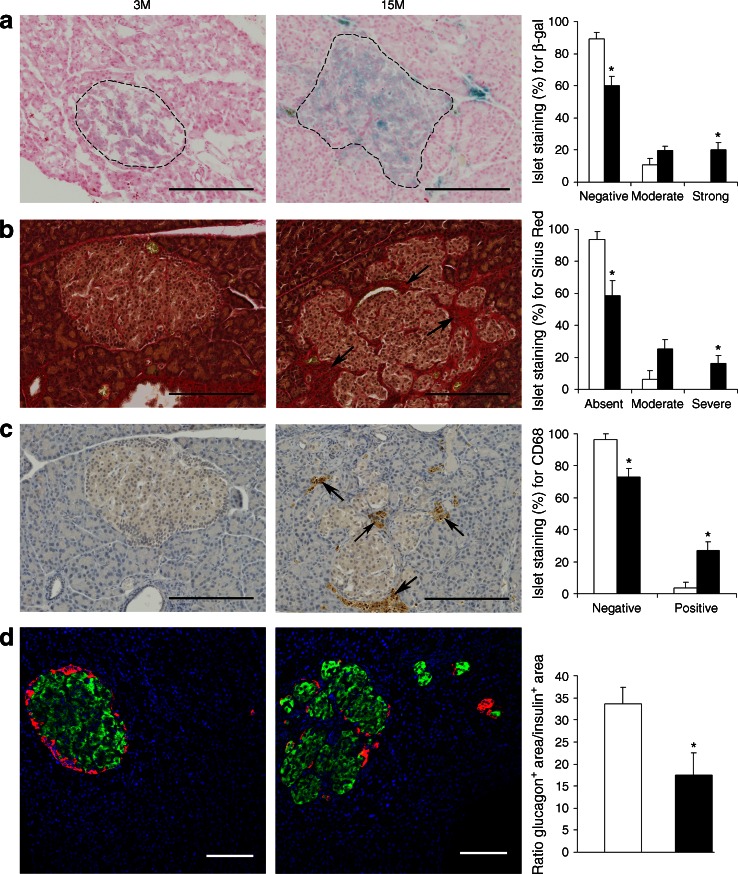
Fig. 4.
Histochemical and immunohistochemical analysis of 3M and 15M rat pancreases. (a) β-Galactosidase (β-gal) staining for cell senescence. The dotted lines outline pancreatic islets. (b) Sirius Red staining for collagen. Arrows indicate deposition of collagen. (c) Immunohistochemical staining for the macrophage marker CD68. Arrows indicate accumulation of macrophages. (d) Double immunostaining for glucagon (red) and insulin (green). Scale bars, 200 μm (a–c) and 100 μm (d). The histograms show the quantification for each stain (white bars, 3M; black bars, 15M). Data represent the mean of n = 4 samples per group; error bars represent SEM; *p < 0.05 for 15M vs 3M, by Mann–Whitney tests

