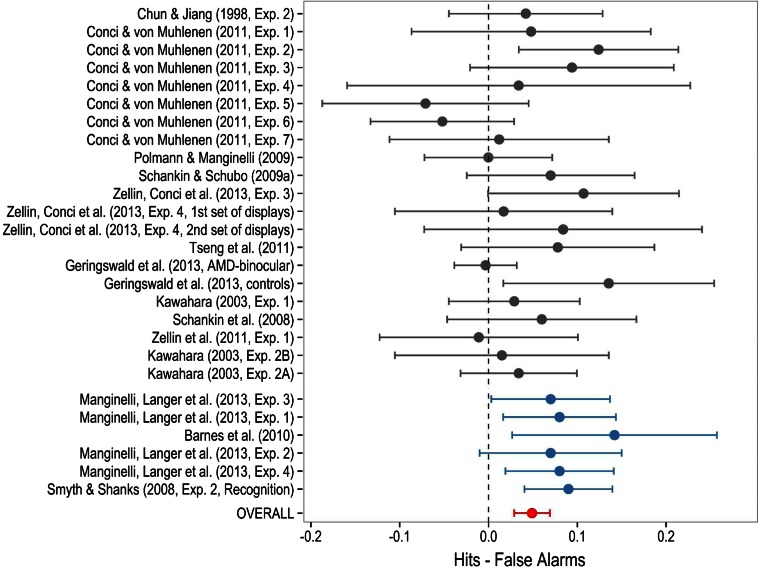
Fig. 4.
Ninety-five percent confidence intervals (CIs) of a subset of experiments contrasting hit rate versus false alarm rate in recognition tests. Given the heterogeneity of the studies included in the figure, Q(26) = 43.73, p = .016, the meta-analytic mean and CI shown in the last row were computed using a random effects model

