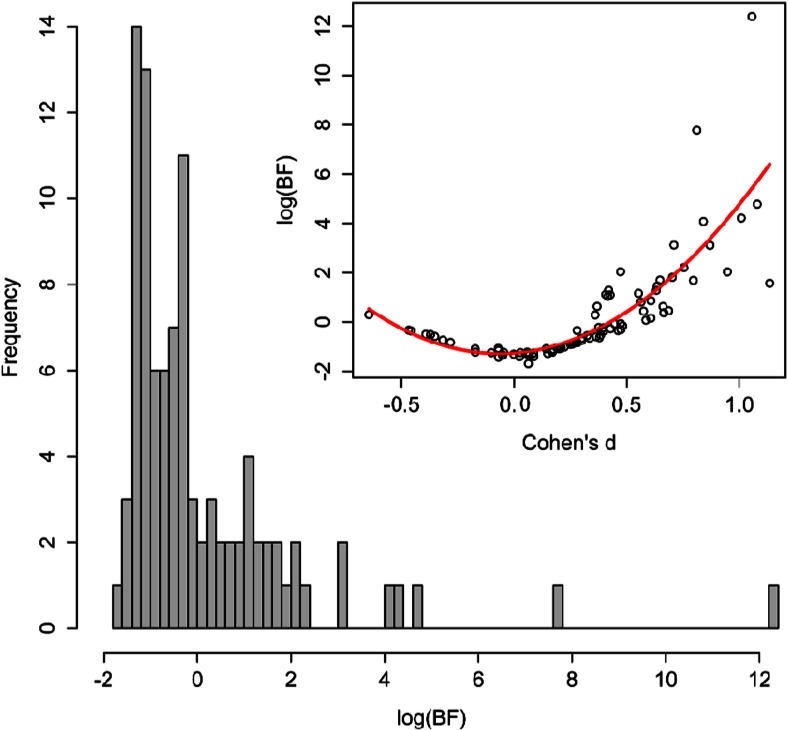
Fig. 5.
Histogram of the logarithmic Bayes Factors (BF 10’s) included in the meta-analysis. Positive values indicate support for the alternative hypothesis (awareness) and negative values indicate support for the null hypothesis (unawareness). The inset depicts a scatterplot of effect sizes (Cohen’s d) and logarithmic BF 10’s with the best fitting quadratic function

