Fig. 1.

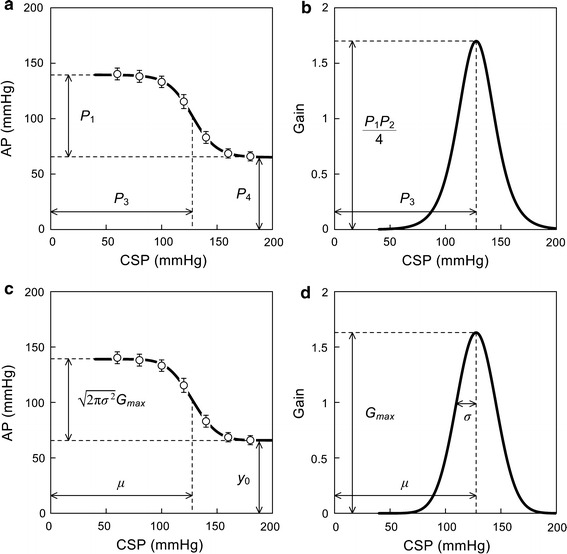
Example of static characteristics of the total reflex arc from carotid sinus pressure (CSP) to arterial pressure (AP) obtained in Sprague–Dawley rats. a Quantification using a four-parameter logistic function. b Gain curve obtained from the first derivative of the fitted logistic function. c Quantification using an integral of a bell-shaped gain curve function. d Bell-shaped gain curve function corresponding to panel c. P 1 response range, P 2 slope coefficient, P 3 midpoint input pressure, P 4 minimum response. G max maximum gain, σ standard deviation, μ midpoint input pressure, y 0 minimum response. In panels a and c, data points represent mean ± SE values (n = 12)
