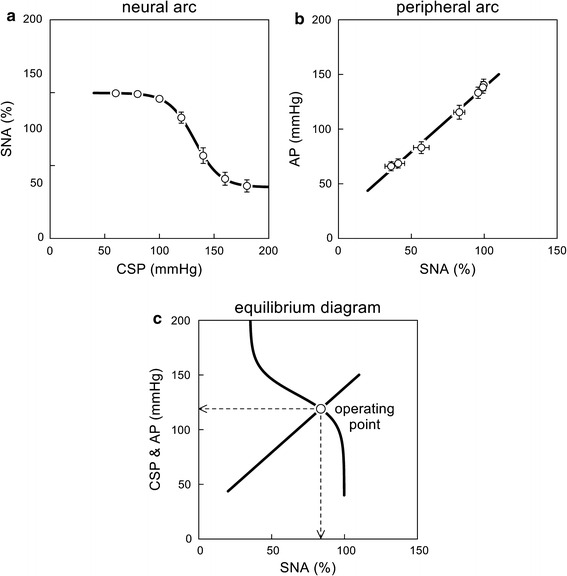
Fig. 2.

a Example of static characteristics of the neural arc from carotid sinus pressure (CSP) to sympathetic nerve activity (SNA). The smooth curve indicates a four-parameter logistic function fitted to the mean data points. b Example of static characteristics of the peripheral arc from SNA to arterial pressure (AP). The straight line indicates a regression line over the mean data points. c Baroreflex equilibrium diagram drawn from the fitted neural arc and peripheral arc. The intersection between the two arcs yields an operating point, which is the point of operation when the baroreflex negative feedback is closed. In panels a and b, data are mean ± SE values (n = 12) derived from the same Sprague–Dawley rats as in Fig. 1
