
Fig. 3.
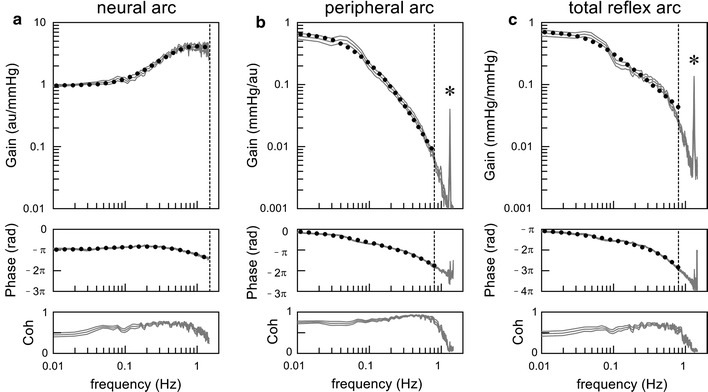
Example of dynamic characteristics of the neural arc (a), peripheral arc (b), and total reflex arc (c) obtained in Sprague–Dawley rats. From top to bottom, the gain plot, phase plot, and coherence (Coh) plot are shown. The gray lines indicate estimated transfer functions shown up to 1.5 Hz (mean ± SE, n = 12). Dotted curves indicate mathematical models fitted to the mean of the transfer functions. The vertical dotted lines indicate the maximum frequency of fitting (1.5 Hz in the neural arc, and 0.8 Hz in the peripheral arc and total reflex arc). In the peripheral arc and total reflex arc transfer functions, a sharp peak is noted at 1.33 H, which is an artifact caused by mechanical ventilation (asterisk)