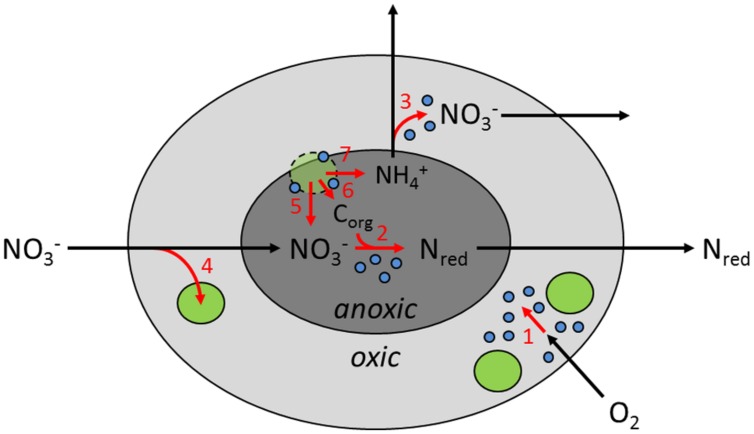
FIGURE 5.
Conceptual model of inorganic nitrogen metabolism in sinking diatom aggregates in the marine pelagial, highlighting the spatial organization of microenvironments, microbes, and metabolic activities (not to scale). Light and dark gray areas represent oxic and anoxic compartments inside the aggregate, respectively. Green and blue circles represent diatom and bacterial cells, respectively. Lysing diatom cells have dashed contours. Nred denotes the sum of any product of dissimilatory nitrate reduction. Black arrows indicate transport of solutes, whereas red arrows indicate microbial turnover of solutes: (1) aerobic respiration, (2) dissimilatory nitrate reduction, (3) nitrification, (4) nitrate storage and/or assimilation by diatoms, (5) nitrate leakage by lysing diatoms, (6) organic carbon (Corg) leakage by diatoms, and (7) DNRA activity by diatoms.

