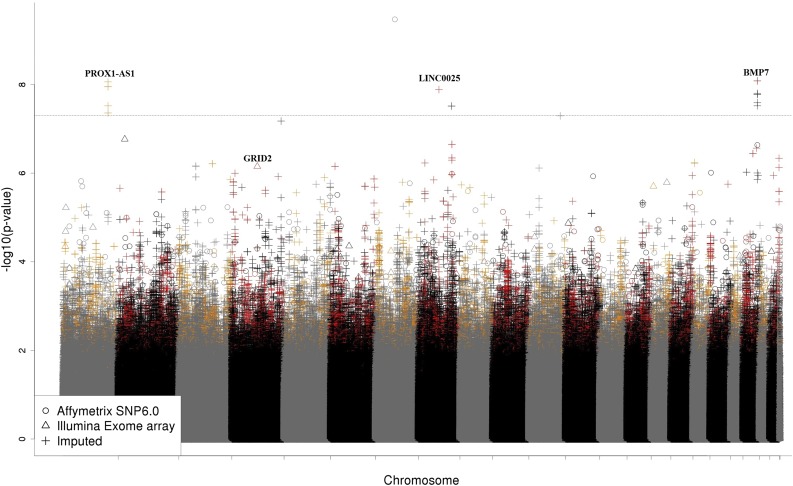
Figure 3.
Manhattan plot of meta-analysis for osteonecrosis in patients 1 to 10 years of age. SNPs (N = 9157) with associations with osteonecrosis (P < .05) in both the discovery and replication cohorts are shown in red or orange. The top coding SNP (rs34144324 in GRID2, meta-analysis P = 7.07 × 10⁻⁷) and loci reaching genome-wide significance (PROX1-AS1, rs1891059, P = 8.72 × 10⁻⁹; LINC00251, rs141059755, P = 1.30 × 10⁻⁸; BMP7, rs79085477 and rs75161997, P = 8.29 × 10⁻⁹) are noted.

