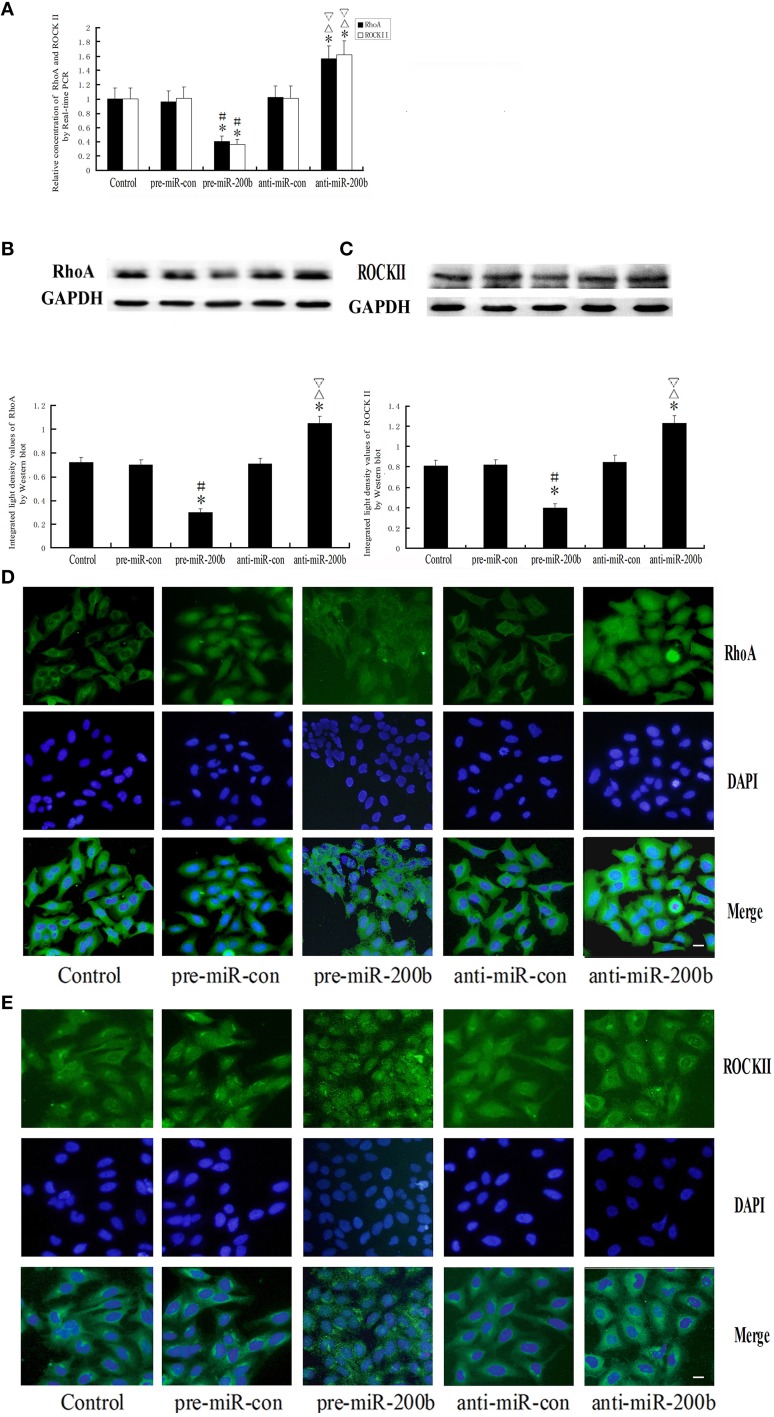
Figure 9.
Alteration of RhoA and ROCKII in GECs of the BTB after overexpression or silencing of miR-200b. (A) Relative mRNA expressions of RhoA and ROCKII as determined by quantitative RT-PCR. GAPDH RNA levels were used as an endogenous control. Values are means ± SD (n = 5/group). *P < 0.05 vs. control group; #P < 0.05 vs. pre-miR-con group; ▵P < 0.05 vs. anti-miR-con group;▿P < 0.05 vs. pre-miR-200b group. (B,C) Protein expressions of RhoA and ROCKII as assessed with Western blot. Values are means ± SD (n = 5/group). *P < 0.05 vs. control group; #P < 0.05 vs. pre-miR-con group; ▵P < 0.05 vs. anti-miR-con group;▿P < 0.05 vs. pre-miR-200b group. (D,E) Distribution and expression of RhoA and ROCKII as detected with immunofluorescence assay. RhoA (green) and ROCKII (green) were, respectively, labeled with fluorescent secondary antibody and nuclei (blue) were labeled with DAPI. Scale bars represent 20 μm.

