
Figure 4.
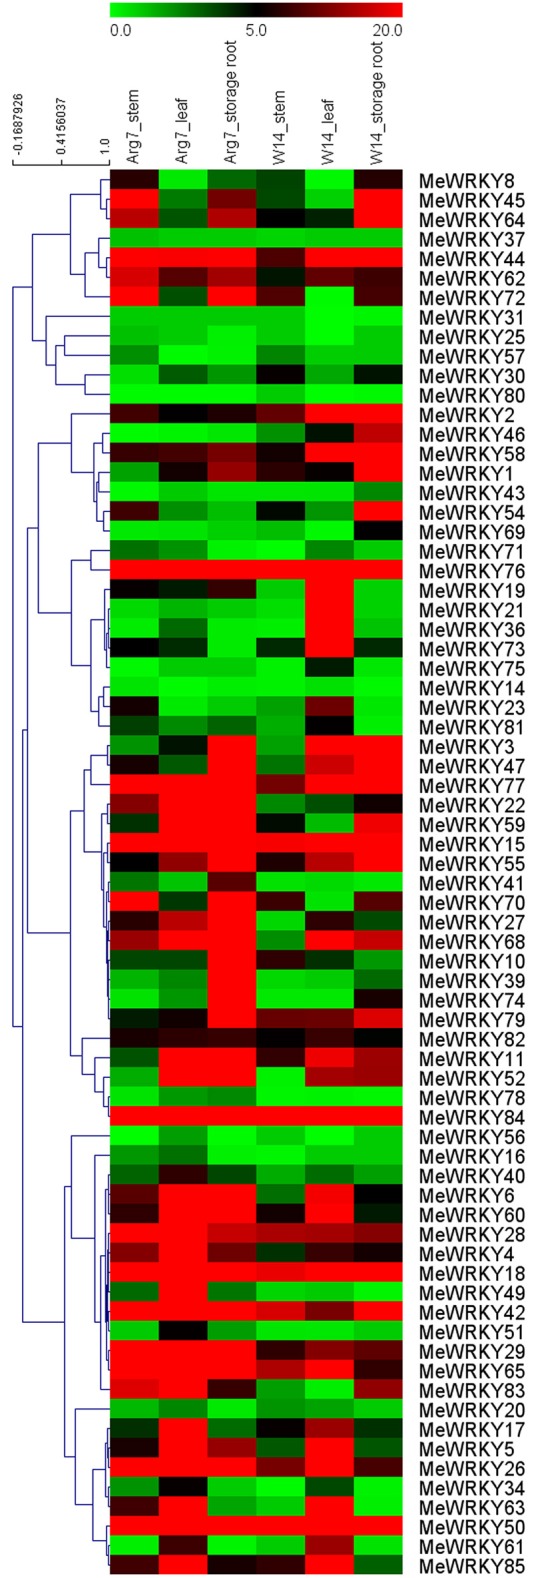
Expression profiles of MeWRKY genes in different tissues of two cassava accessions. FPKM value was used to create the heat map with clustering. The scale represents the relative signal intensity of FPKM values.
Official websites use .gov
A
.gov website belongs to an official
government organization in the United States.
Secure .gov websites use HTTPS
A lock (
) or https:// means you've safely
connected to the .gov website. Share sensitive
information only on official, secure websites.
Expression profiles of MeWRKY genes in different tissues of two cassava accessions. FPKM value was used to create the heat map with clustering. The scale represents the relative signal intensity of FPKM values.