
Figure 5.
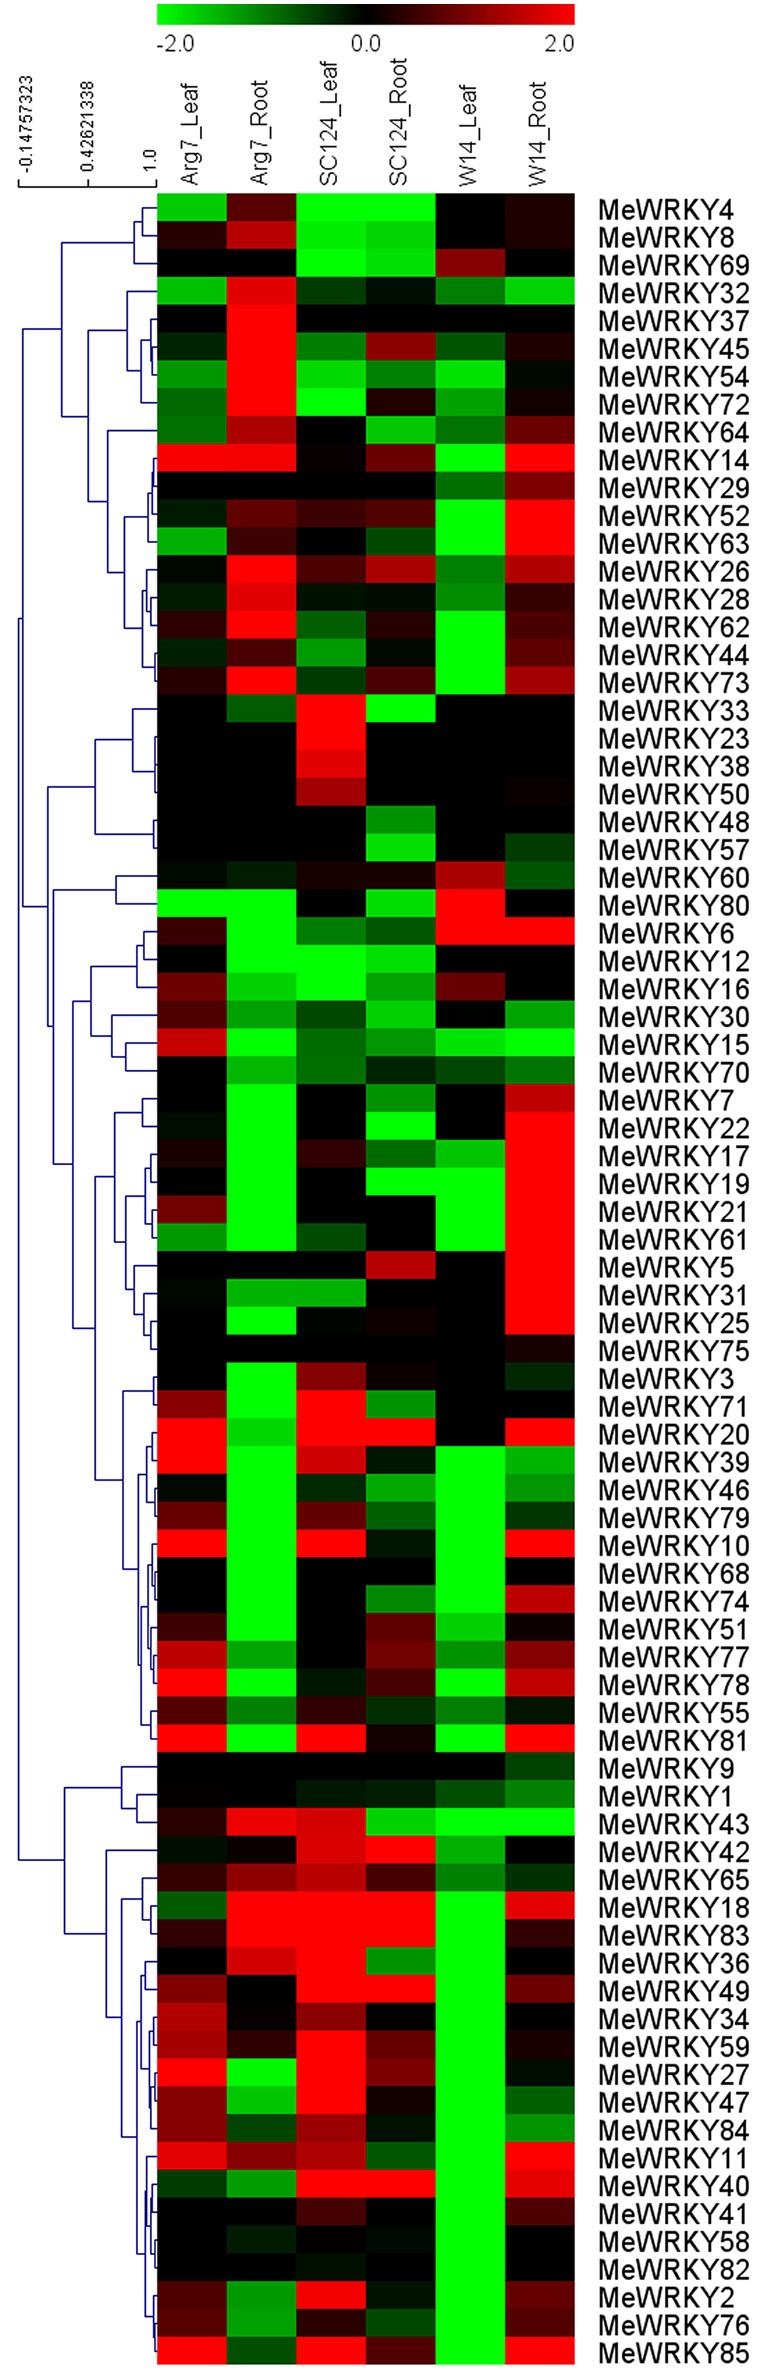
Expression profiles of MeWRKY genes in leaves and roots of three cassava accessions after drought treatment. Log2 based FPKM value was used to create the heat map with clustering. The scale represents the relative signal intensity of FPKM values.