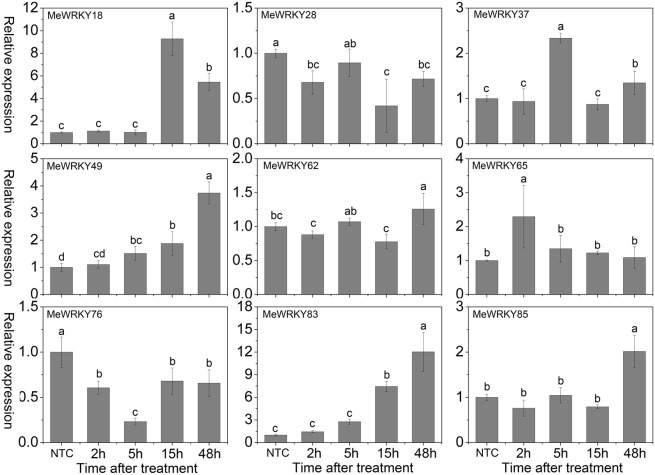
Figure 8.
Expression profiles of MeWRKY genes in leaves under cold treatment. The relative expression levels of MeWRKY genes in each treated time point were compared with that in each time point at normal conditions. NTC (no treatment control) at each time point was normalized as “1.” Data are means ± SE calculated from three biological replicates. Values with the same letter were not significantly different according to Duncan's multiple range tests (P < 0.05, n = 3).

