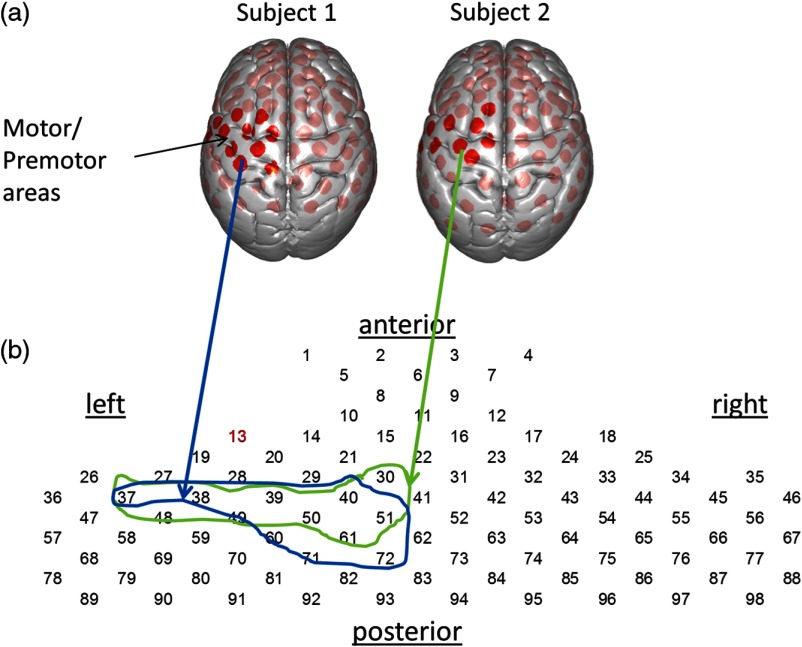
Fig. 1.
(a) Locations and number identifications of recording channels superimposed on standard MNI brain surface for two typical subjects, shown as red dots. The dark red dots indicate the channels identified as primary or premotor cortex on the left hemisphere. (b) The schematic channel layout used for the event triggered averages (see Fig. 2). The circled ROIs include the anatomical regions (channels shown as dark red dots above, see Table 1). Note the individual difference in anatomical locations for their channels.

