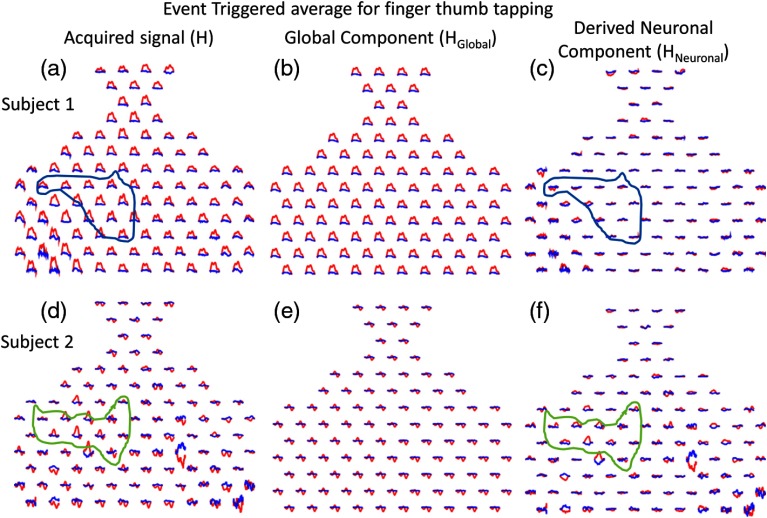
Fig. 2.
The event-triggered average fNIRS data responding to the finger thumb tapping task are shown for two typical subjects and for both oxyhemoglobin (red) and deoxyhemoglobin (blue) signals. The time span for each trace is 30 s, where the task period is from 0 to 15 s and the rest period is from 15 to 30 s. (a) and (d) The acquired fNIRS signal [H in Eq. (5)] is shown. (b) and (e) The global component [ in Eq. (5)] is shown. (c) and (f) The derived neuronal component [ in Eq. (5)] is shown.

