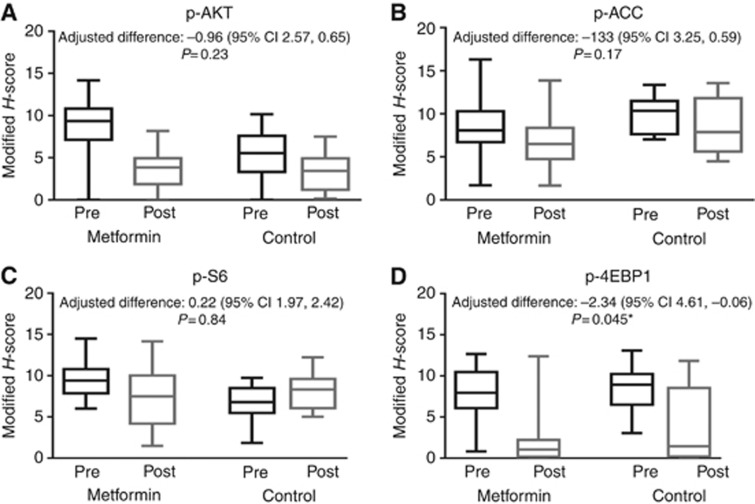
Figure 3.
Phosphorylation changes in (A) AKT, (B) ACC, (C) S6 and (D) 4EBP1 using box and whisker plots representing the median modified H-score (middle line) and the first and third quartile from paired pre- and postintervention endometrial biopsies for metformin-treated and control patients. The whiskers represent the maximum and minimum values.

