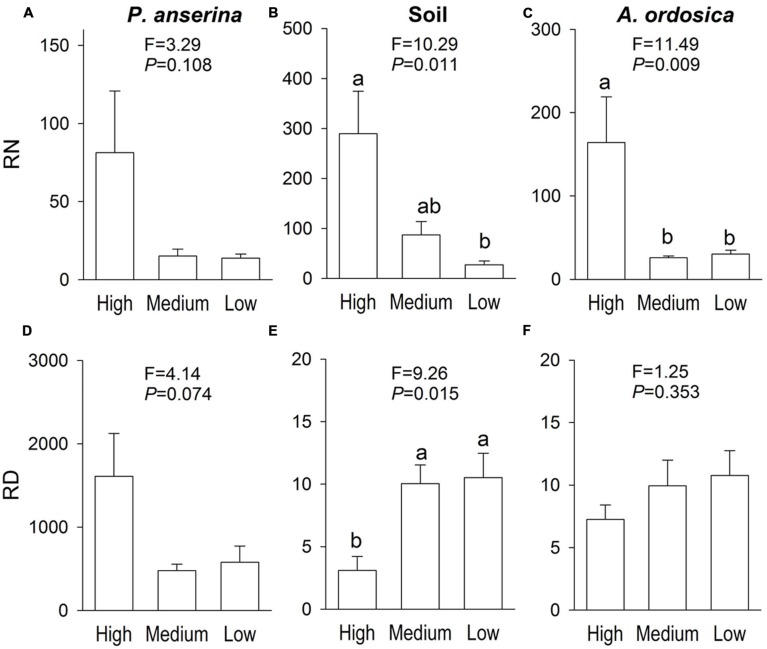
FIGURE 2.
The ratio of δ15N (RN, above, in Experiment I) and the ratio of δD (RD, below, in Experiment II) in Potentilla anserina leaves (A,D), soils (B,E), and A. ordocia leaves (C,F) in the unlabeled, recipient containers with the high, medium and low water treatments that were connected to the P. anserina ramets with the high water supply. All means are significantly greater than 1 (one-sample t-tests). The F and P-values of the one-way ANOVA are also provided, and different letters indicate significant differences in means among treatments.

