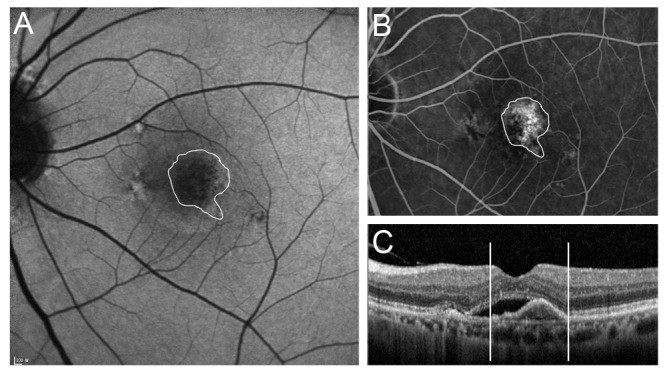
Fig. 2. Gray scale measurements of fundus autofluorescence (FAF) images for choroidal neovascularization (CNV) areas delineated in fluorescein angiography (FA) and spectral domain optical coherence tomography (SD-OCT) were analyzed using the ImageJ program. (A) FAF image of CNV. White line indicates the boundary of CNV. (B) FA image of CNV. White line indicates the boundary of CNV. (C) SD-OCT image of CNV. White vertical lines indicate the diameter of CNV.

