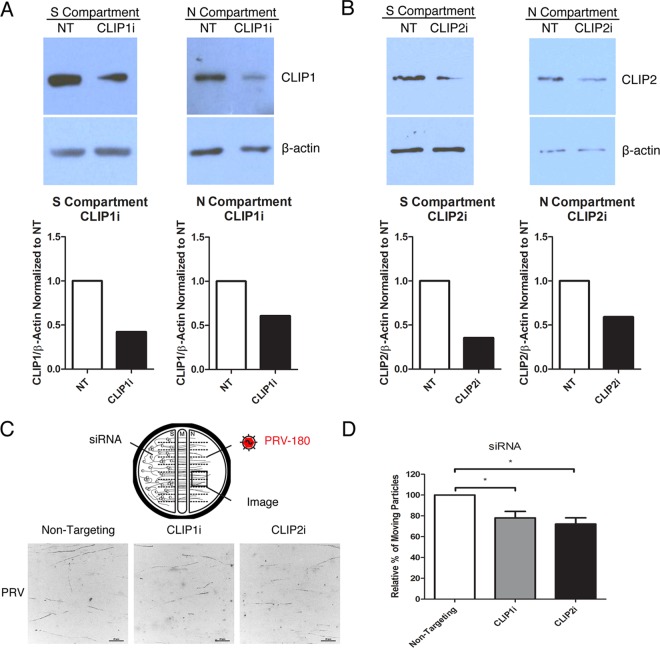
FIG 6 .
Reducing the level of Clip1 or Clip2 restricts PRV particle transport. (A and B) Immunoblotting of Clip1 (A) and Clip2 (B) in cell bodies in the S compartment and axons in the N compartment after transfection with nontargeting (NT), Clip1 or Clip2 siRNA in the S compartment. Quantification of Clip1 (A) and Clip2 (B) bands is shown below each blot. Bands were normalized to internal control β-actin of each sample and to the NT siRNA sample. (C and D) Cell bodies were transfected with NT, Clip1, or Clip2 siRNA before PRV-180 inoculation (5 × 10⁵ PFU) in the N compartment. Movement of fluorescent particles in the N compartment was recorded at ~3 fps. (C) Stack images of representative movies. Each dot represents a stalled particle, and each line represents a moving particle (bars, 20 µm). (D) Quantification of the percentage of moving particles. The results are normalized to the values for NT siRNA samples. Data are shown as means plus SEMs. Values that are significantly different (P < 0.05) by Student’s t test (n = 4) are indicated by bars and an asterisk.

