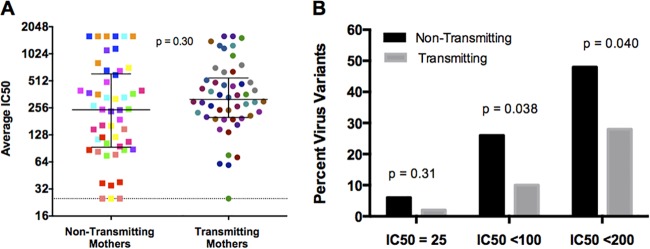
FIG 2 .
Autologous NAb responses of nontransmitting and transmitting mothers. (A) IC50s of nontransmitting and transmitting mothers are color coded by mother. Each square or dot represents the IC50 of an individual envelope variant tested against contemporaneous autologous plasma. Data are shown as raw IC50s on a log2 scale; black bars represent medians and IQRs, and the dotted line represents an IC50 of 25 (resistant to neutralization at a 1:50 dilution). The P value is based on logistic regression with clustered standard errors using log2-transformed data. (B) Percentages of virus variants with IC50s below the detection limit, which we defined as the midpoint between 0 and the lowest dilution tested (IC50, 25); IC50s of <100; and IC50s of <200 for nontransmitting (black) and transmitting (gray) mothers. The P values were determined by t tests comparing the proportions of neutralization-resistant viruses of transmitting and nontransmitting mothers at the IC50s shown.

