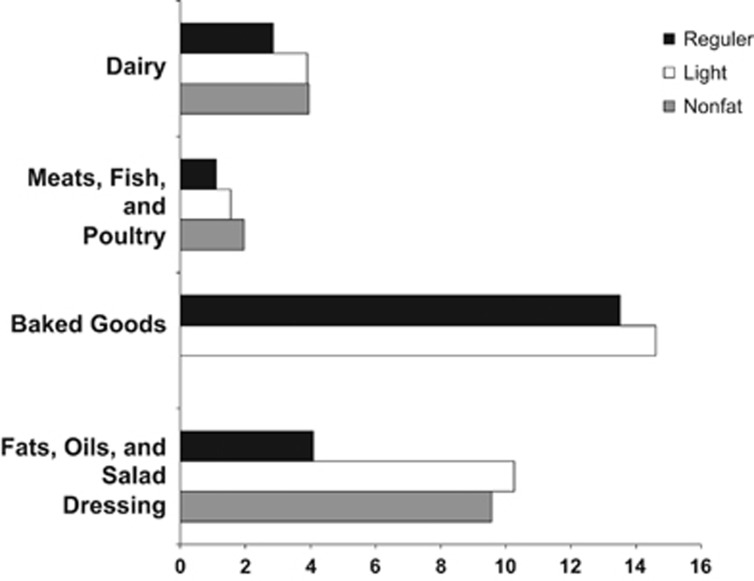
Figure 1.
Bar graph showing the median sugar content (g) of selected food items grouped by major food categories. Data taken from USDA National Nutrient Database released in 2014. Dairy: regular vs low calorie (P=0.011) vs non fat (P=0.036); meat, fish and poultry: regular vs low calorie (P=0.080) vs non fat (P=0.043); baked goods: regular vs low calorie (P=0.0180); fats, oils and salad dressings: regular vs low calorie (P=0.091) vs non fat (P=0.0180).

