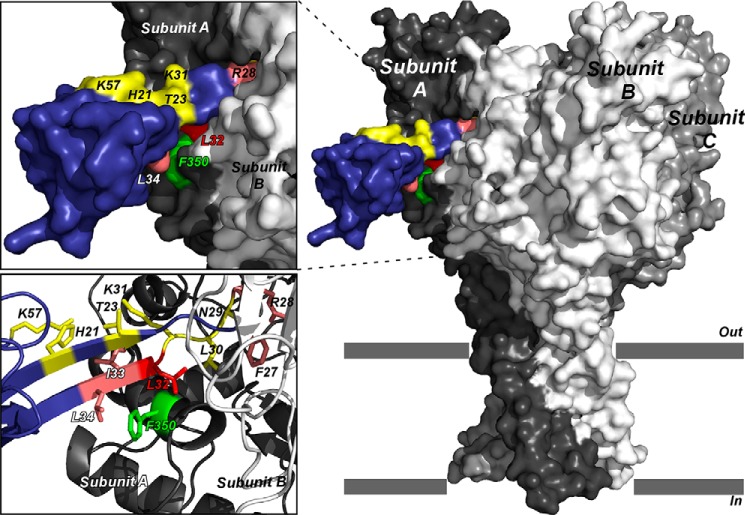
FIGURE 9.
Selected binding model of sMamb-1 crystal structure on the three-dimensional model structure of rat ASIC1a. Surface representation of the ASIC1a-mambalgin-1 complex (side view). Subunits are shown with different gray levels and toxin is shown in blue. A close view of the binding interface between ASIC1a and mambalgin-1 is shown on the top left. Mutated residues are colored in pink and yellow for interacting and non-interacting ones, respectively. Key residue Leu-32 is shown in red, and residue Phe-350 in ASIC1a that may form part of the binding surface is indicated in green (10). Bottom left, zoom on the interaction surface between sMamb-1 and ASIC1a, highlighting the proximity between Phe-350 and the toxin.

