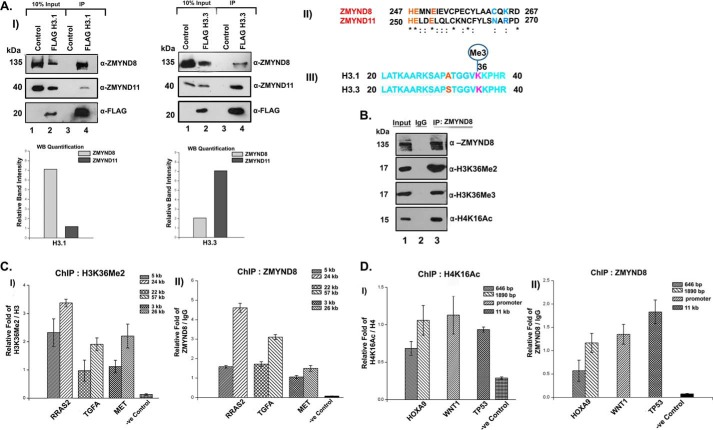
FIGURE 3.
Preferential interaction of ZMYND8 with H3.1K36Me2/H4K16Ac ex vivo. A, interaction of ZMYND8 with H3.1 or H3.3 histones. HEK293 cells were transiently transfected with FLAG-H3.1/FLAG-H3.3. M2-agarose pull down was done and subsequently probed with α-ZMYND8 antibody. ZMYND11 was used as a control. Western blot quantification showed the preferential interaction of ZMYND8 with H3.1 and ZMYND11 with H3.3 (panel I). Blots were quantified using ImageJ software from National Institutes of Health. Sequence alignment of histone H3 binding pocket of ZMYND11 and similar sequence stretch in ZMYND8 by ClustalW. Critical residues marked in blue mediating H3.3 binding in ZMYND11 (Asn and Arg) are substituted in ZMYND8 (by Cys and Lys) (panel II). Sequence alignment of histone H3.1 and H3.3 spanned amino acids 20–40. The variation at the N-terminal tail is at amino acid Ala-31 for H3.1 which is replaced by Ser-31 for H3.3 (marked in red) (panel III). B, interaction of ZMYND8 with modified histones. Endogenous ZMYND8 was co-immunoprecipitated from HEK293 cells and immunoblotted for ZMYND8, H3K36Me2, H3K36Me3, and H4K16Ac. IgG pull down served as a negative control. C, ChIP assays were performed in HEK293 cells with α-H3K36Me2 and α-ZMYND8 antibodies to check for enrichment of H3K36Me2 (panel I) and ZMYND8 (panel II) at RRAS2, TGFA, and MET gene loci and a negative control region (depleted of H3K36Me2 and H4K16Ac). Two separate regions of each of the genes (5 and 24 kb for RRAS2, 22 and 57 kb for TGFA, and 3 and 26 kb for MET, downstream from start site) were selected for designing primers. D, similarly, ChIP assays were performed in HEK293 cells with α-H4K16Ac and α-ZMYND8 antibodies to show enrichment of H4K16Ac (panel I) and ZMYND8 (panel II) at HOXA9, WNT1, and TP53 gene loci and a negative control region (depleted of H3K36Me2 and H4K16Ac). Two separate regions of 646 and 1890 bp downstream from the start site were selected for designing primers from HOXA9 gene. WNT1 primers were for promoter region, whereas the TP53 primer was designed 11 kb downstream. Quantitative PCR was done, and relative fold was plotted normalizing by IgG. For H3K36Me2 and H4K16Ac, ChIP relative fold was further normalized to endogenous H3 and H4, respectively. At least three separate experiments were performed. Error bars show standard deviation.

