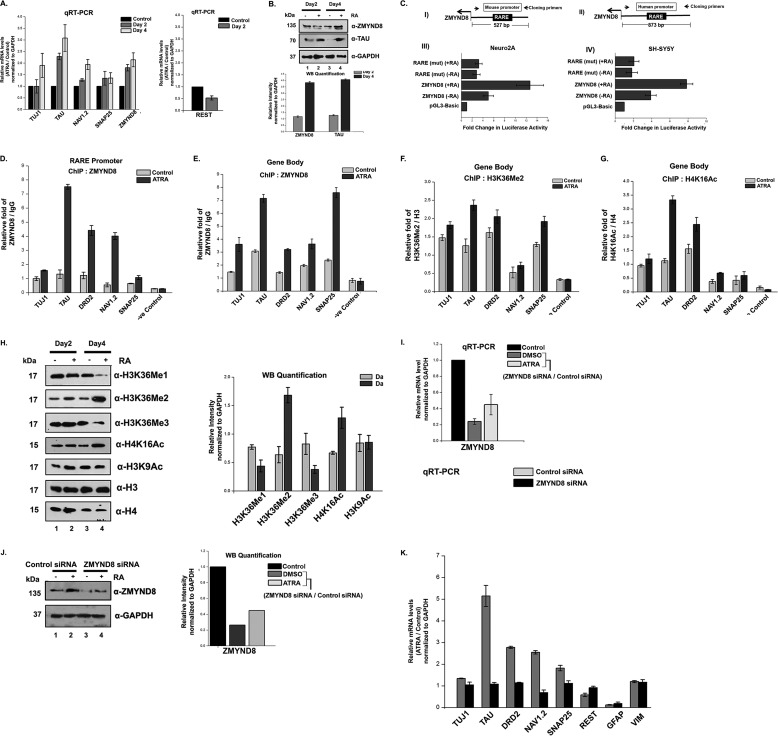
FIGURE 5.
ZMYND8 is ATRA-responsive and regulates other RA-inducible genes. A, ATRA treatment of SH-SY5Y cells for 2 and 4 days, respectively, leads to an increase in ZMYND8 RNA level. TAU, TUJ1, NAV1.2, SNAP25, and REST were used as controls. Relative mRNA level was plotted for ATRA-treated differentiated cells over DMSO-treated undifferentiated cells and normalized to GAPDH. At least three individual experiments were performed. Error bars show standard deviation. B, alteration in the expression of ZMYND8 protein abundance in SH-SY5Y cells upon ATRA treatment for 2 and 4 days. Western blotting was done by probing with α-ZMYND8, α-TAU, and α-GAPDH antibodies. GAPDH was used as loading control. At least three individual experiments were performed. Error bars show standard deviation. Blots were quantified using ImageJ software from National Institutes of Health. C, schematic diagram shows the upstream regulatory region of mouse (panel I) and human (panel II) ZMYND8 genes with the arbitrary position of RARE and the primer pairs used to clone those regions into pGL3-basic vector. The respective reporter constructs were transiently transfected into Neuro2A (panel III) and SH-SY5Y (panel IV) cells, respectively, with/without ATRA treatment followed by luciferase assay. The activities are shown as mean fold enhancement compared with the empty vector after normalization with Renilla luciferase activity. Here, the constructs containing mutated RARE sequence are named as RARE-mut. Each transfection was performed in triplicate, and the experiments were repeated at least three times. Error bar shows standard deviation. D–G, relative enrichment of ZMYND8 on the RARE harboring sequence of promoter of RA-responsive genes (TUJ1, TAU, DRD2, NAV1.2, and SNAP25) was observed (D). Similar enrichment of ZMYND8 (E), H3K36Me2 (F), and H4K16Ac (G) onto gene body region of TUJ1, TAU, DRD2, NAV1.2, and SNAP25 genes was monitored. ChIP assays were performed after 4 days of ATRA treatment in SH-SY5Y cells with α-ZMYND8 antibody. Relative fold was calculated by normalizing ZMYND8 with IgG for both DMSO (control) and ATRA-treated cells. At least three separate experiments were performed. Error bars show standard deviation. H, alteration in the expression of different epigenetic marks upon ATRA treatment for 2 and 4 days. Western blotting was done by probing with α-H3K36Me1, α-H3K36Me2, α-H3K36Me3, α-H4K16Ac, and α-H3K9Ac antibodies from whole cell extracts and quantified by ImageJ software from National Institutes of Health. α-H3 and α-H4 are used as loading controls for respective modifications. At least three separate experiments were done. Error bars show standard deviation. I, ZMYND8 silencing was done in 2 days of ATRA- or DMSO- treated SH-SY5Y cells. Similar experiments were performed with non-targeting siRNA, as negative control. Total mRNA level was analyzed by quantitative PCR, and GAPDH was used for normalization. Reference level was considered as 1. J, ZMYND8 knockdown in SH-SY5Y cells was scored by Western blotting after ATRA treatment for 2 days, with α-ZMYND8 antibody. GAPDH was used for normalization. Blots were quantified using ImageJ software from National Institutes of Health. K, alterations in the expression of neuronal markers (TUJ1, TAU, DRD2, NAV1.2, and SNAP25), glial markers (GFAP and VIM), and pluripotency marker REST were measured after ZMYND8 siRNA (or a non-targeting siRNA as negative control) transfection during 2 days of ATRA or DMSO treatment in SH-SY5Y cells. Total mRNA level was scored by quantitative PCR normalizing to GAPDH. Relative mRNA level was plotted as ATRA-treated differentiated cells over DMSO-treated undifferentiated cells. Reference level considered as 1. At least three separate experiments were done. Error bars show standard deviation.

