FIGURE 7.
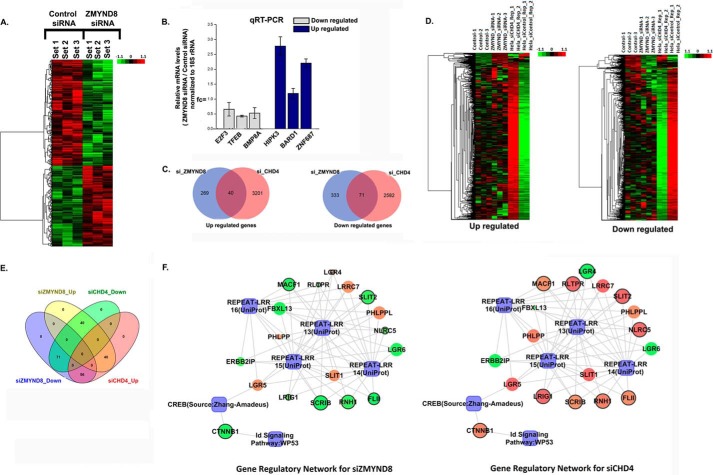
Regulation of global gene expression by ZMYND8 in a NuRD-independent mode. A, clustering and heat maps of expression values for differentially expressed genes. Down-regulated genes are marked in green, and up-regulated genes are marked in red. From left to right, first three samples are control siRNA-treated and latter three samples are ZMYND8 siRNA-treated HeLa cells. B, validation of microarray analysis. Bars show candidate up-regulated and down-regulated genes after knocking down ZMYND8 in HeLa cells. 18S rRNA was used for normalization. Reference level was considered as 1. At least three individual experiments were performed. Error bars show standard deviation. C, Venn diagram showing the overlap between up- and down-regulated genes in ZMYND8 or CHD4 knocked down HeLa cells. D, clustering and heat maps of up- and down-regulated genes in ZMYND8 knocked down and CHD4 knocked down HeLa cells. E, overlapping Venn diagram for common differentials between ZMYND8 and CHD4. The pink circle represents up-regulated genes in siCHD4, and the green circle is for down-regulated genes in siCHD4; the yellow circle is for up-regulated genes in siZMYND8, and the blue circle represents down-regulated genes in siZMYND8. As they have common differential genes, so the overlapping areas are in different colors. F, networks for ZMYND8 knocked down and CHD4 knocked down HeLa cells based on the common biology. The genes whose regulation are opposite in the two networks are bordered in black. The genes are colored according to their fold change and sized based on their p value which is <0.05. Green and red ellipses denote down-regulation and up-regulation, respectively, and the processes are denoted by a blue rectangle.

