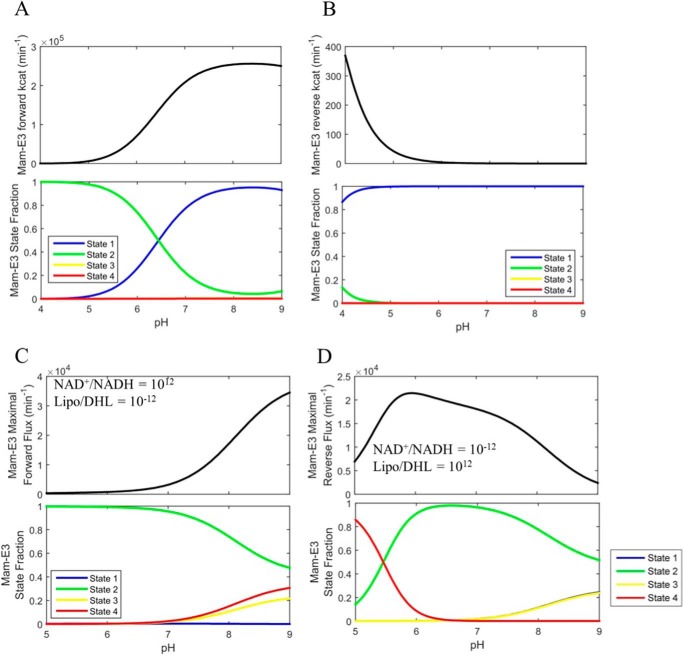
FIGURE 11.
Mammalian E3 pH-dependent forward/reverse kcat and maximal forward/reverse pH-dependent fluxes with corresponding enzyme fractional states. A, top, mammalian E3 forward kcat as a function of pH was calculated as described under “Experimental Procedures” using globally fitted parameters (Table 1) obtained by fitting the data in Fig. 6 to the 4-state redox model. Bottom, enzyme redox fractional states corresponding to the forward kcat in A were calculated as described under “Experimental Procedures.” B, top, mammalian E3 reverse kcat as a function of pH was calculated in the same manner as the forward kcat and as described under “Experimental Procedures.” Bottom, enzyme redox fractional states corresponding to the reverse kcat were calculated as described under “Experimental Procedures.” C, top, parameterized (Table 1) 4-state redox-dependent flux expression was maximized using NAD+/NADH, Lipo/DHL, and pH as adjustable parameters to produce a flux maximized in the forward direction, shown as a function of pH. The lipoamide and NAD pool were constrained to 10 and 3 mm, respectively. Bottom, enzyme redox fractional states corresponding to the flux were computed with the resulting NAD+/NADH and Lipo/DHL ratios of 1012 and 10−12 respectively, as a function of pH. D, top, parameterized (Table 1) 4-state redox flux expression was maximized using NAD+/NADH, Lipo/DHL, and pH as adjustable parameters to produce a maximal flux in the reverse direction, shown as a function of pH. The lipoamide and NAD pool were constrained to 10 and 3 mm, respectively. Bottom, enzyme redox fractional states corresponding to the flux were computed with the resulting NAD+/NADH and Lipo/DHL ratios of 10−12 and 1012, respectively, as a function of pH. Table 2 provides the fitted parameter values for this analysis.

