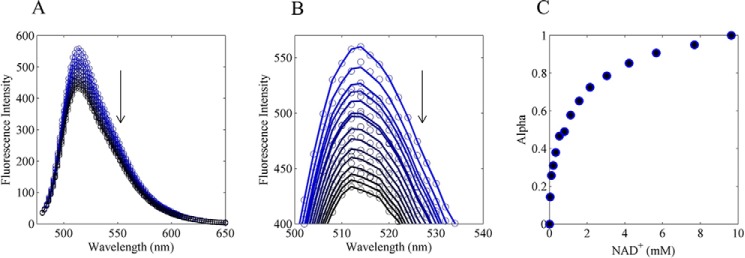
FIGURE 2.
Equilibrium NAD+ titration of pig heart E3. A, pig heart E3 FAD fluorescence was excited at 455 nm and titrated with NAD+ in conditions described under “Experimental Procedures.” Pig heart E3 FAD fluorescence was quenched by increasing amounts of NAD+ (blue to black). B, linear least squares method was applied to estimate the fraction of bound NAD+ assuming the observed spectra are a linear sum of bound and unbound spectra (see “Experimental Procedures”). Solid lines are calculated spectra, and circles are observed spectra. C, determined α values are shown as a function of total NAD+.

