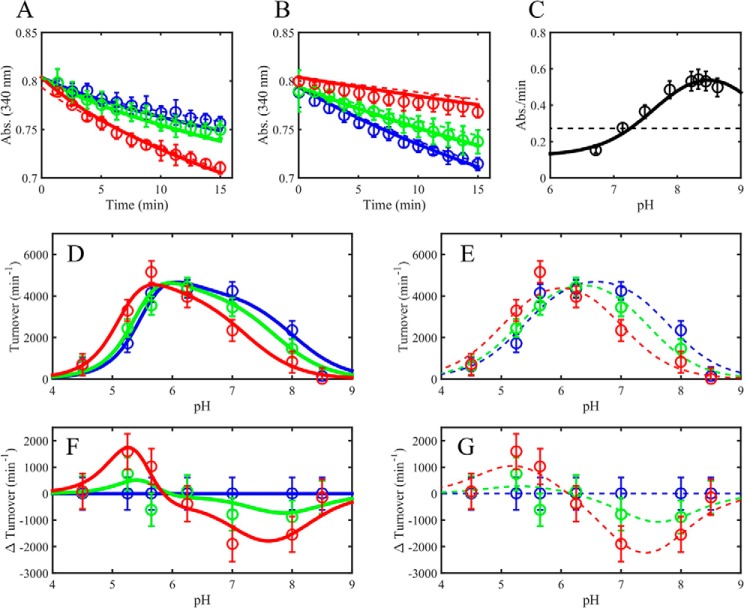
FIGURE 5.
Mammalian E3 pH-dependent NAD+ activation/inhibition. A, pig heart E3 reverse reaction progress curves in acidic conditions (pH 5.25) in different initially added amounts of NAD+ (0, 100, and 500 μm), shown as blue, green, and red circles, respectively. Model simulations are shown as dashed (3-state model) and solid (4-state model) lines of the corresponding data marker color. B, pig heart E3 reverse reaction progress curves at basic conditions (pH 8) in different initially added amounts of NAD+ (0, 100, and 500 μm), shown as blue, green, and red circles, respectively. Model simulations are shown as dashed (3-state model) and solid (4-state model) lines of the corresponding data marker color. C, human liver E3 pH-dependent forward initial rates (black circles) taken from Fig. 5 of Ref. 33. Model simulations are shown as black dashed (3-state model) and solid (4-state model) lines. D, pig heart E3 pH-dependent reverse initial rates in different initially added amounts of NAD+ (0, 100, and 500 μm), shown as blue, green, and red circles, respectively, with 4-state model simulations shown as solid lines. E, pig heart E3 pH-dependent reverse initial rates (as in D) with 3-state model simulations shown as dashed lines of the corresponding data marker color. F, difference plots (observed turnover (NAD+ added) − observed turnover (no NAD+)) of data and simulations shown in D corresponding to the 4-state model. G, difference plots (observed turnover (NAD+ added) − observed turnover (no NAD+)) of data and simulations shown in E corresponding to the 3-state model. A–E, error bars represent standard deviations of the data from at least three experimental repeats, where error bars in F and G represent the propagation of error from the difference of the observed rates.

