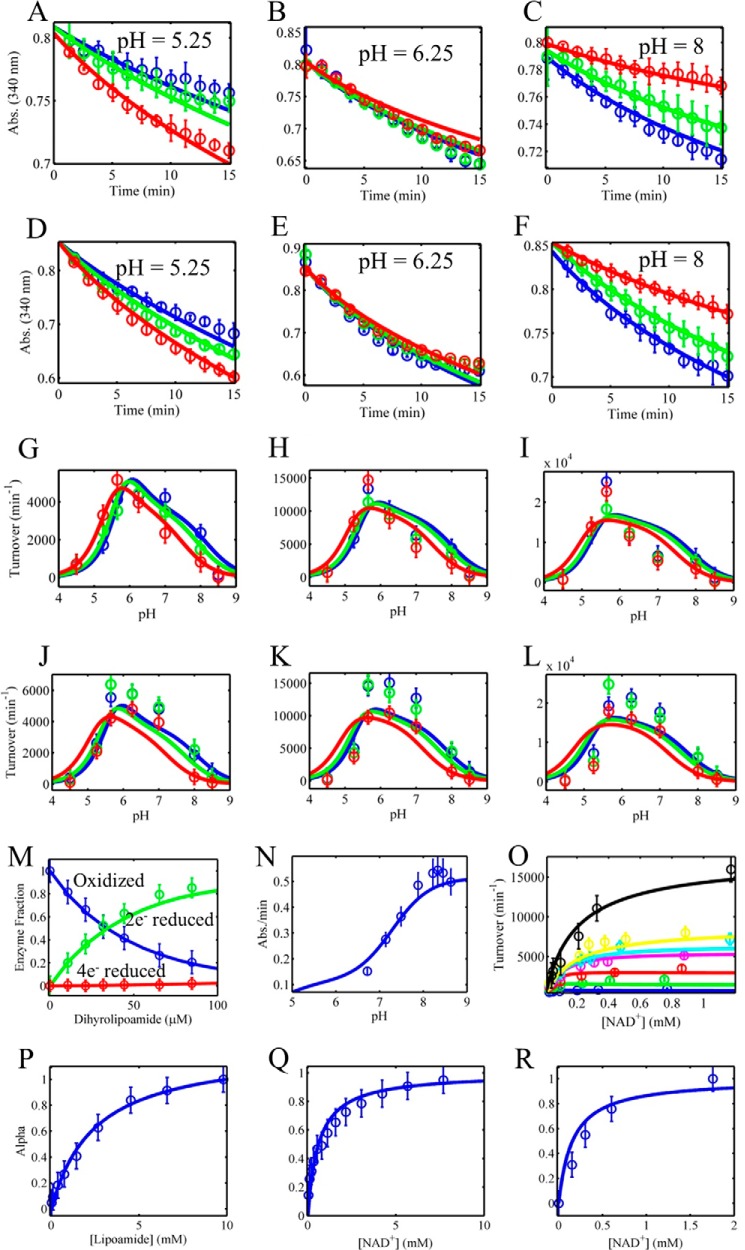
FIGURE 6.
Global fitting of mammalian E3 reverse progress curves, reverse/forward initial velocity, and equilibrium titration data to a 4-state redox model with redox-dependent equilibrium dissociation constants. A–F, pig heart E3 reverse reaction progress curve data were collected in different initially added amounts of NAD+ (0, 100, and 500 μm), shown as blue, green, and red circles, respectively. Model simulations (4-state model) are shown as solid lines of the corresponding data marker color. All time-dependent assays shown in A–F contained 500 μm initially added NADH. A–C and D–F contained 0.25 and 1 mm dl-lipoamide, respectively. pH was held fixed at 5.25, 6.25, and 8 shown in A–C and D–F, respectively. G–L, pig heart E3 pH-dependent reverse initial velocity data were collected in different initially added amounts of NAD+ (0, 100, and 500 μm), shown as blue, green, and red circles, respectively. Model simulations (4-state model) are shown as solid lines of the corresponding data marker color. Initial rates shown in G–I were obtained in 500 μm initially added NADH and 0.25 (G), 1 (H), and 3 mm (I) dl-lipoamide. Initial rates shown in J–L were obtained with 250 μm initially added NADH and 0.25 (J), 1 (K), and 3 mm (L) dl-lipoamide. M, pig heart E3 fractional redox states were obtained from the dihydrolipoamide equilibrium titration shown in Fig. 4, D–F. The oxidized, 2e− reduced, and 4e− reduced states as a function of dihydrolipoamide are shown as blue, green, and red circles, respectively. N, human liver E3 forward initial rate data as a function of pH was obtained from Fig. 5 of Ref. 33 and fitted along all other datasets in this figure. O, forward initial rate data (circles) as a function of NAD+ in different fixed concentrations of dihydrolipoamide (25 (blue), 40 (green), 50 (red), 100 (magenta), 250 (cyan), 500 (yellow), and 750 μm (black)) were taken from the top of Fig. 1 in (63) and simulated (lines) with globally fitted parameters along with all other datasets shown in this figure. P–R, α values (blue circles) obtained from Figs. 2C, 3C, and 4C were simulated (blue lines) with globally fitted parameters assuming rapid equilibrium binding of each ligand described by their corresponding enzyme state fractional occupancies (Equation 3). Error bars represent standard deviations of the data from at least three experimental repeats, and error bars for literature-derived data sets (M–O) were assigned a 10% error according to the maximum ordinate value.

