FIGURE 3.
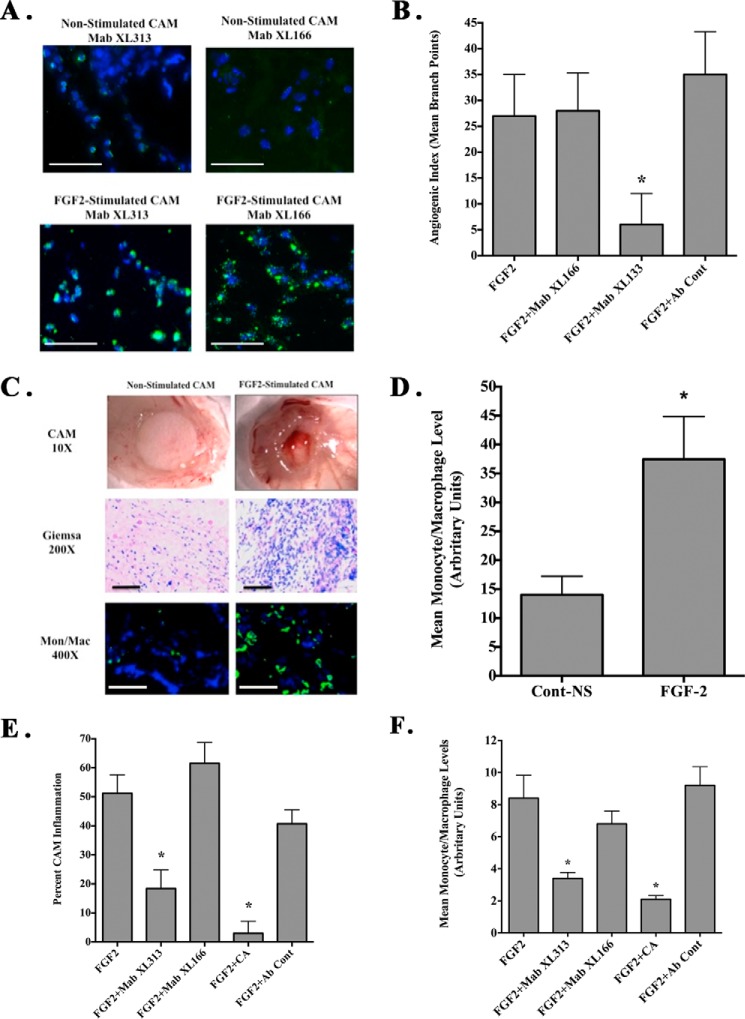
Differential effects of cryptic RGD collagen motifs on angiogenesis and inflammation in vivo. CAMs were either unstimulated or stimulated with FGF-2 in the presence or absence of CA. A, representative examples of unstimulated or FGF-2-stimulated CAM tissues stained with mAbs XL313 and XL166 (green). Scale bars, 50 μm. B, quantification of FGF-2-induced angiogenesis in the absence or presence of mAbs XL313, XL166, or nonspecific control antibody. Data bars represent mean number of angiogenic branching vessels ± S.E. from 8 to 10 animals per condition. Experiments were completed at least three times with similar results. C, unstimulated or FGF-2-stimulated CAMs in the absence of cortisone acetate. Representative examples of inflammatory CAM thickening (top panel), Giemsa-positive inflammatory infiltrates (middle panel), and infiltration of macrophages (green) following staining with anti-avian-specific macrophage marker KUL1 (bottom panel) are shown. Scale bars, 50 μm. D, quantification of relative macrophage infiltration following FGF-2 stimulation in the absence of CA. Data bars represent mean ± S.E. levels of KUL-expressing avian macrophages per ×100 microscopic field from five fields per CAM and 10 CAM per condition. *, p < 0.05. E, quantification of FGF-2 induced inflammation in the absence or presence of mAbs XL313, XL166, CA, or nonspecific control antibody. Data bars represent mean percentage inflammatory CAMs ± S.E. Experiments were completed at least three times with similar results. *, p < 0.05. F, quantification of relative macrophage infiltration. Data bars represent mean ± S.E. of the levels of KUL-expressing avian macrophages per ×400 microscopic field from 9 to 10 fields per CAM and five CAM per condition. *, p < 0.05.

